Calcium Alginate Price Trend Analysis 2026: Historical Prices, Market Insights, Price Drivers, Supply Demand Analysis & Latest News

Siddharth David profile photo
Written BySiddharth David

Procurement Resource Database

Laptop screen

Turn price intelligence into action with the Procurement Resource Database. Log in or subscribe to unlock live price trends, historical charts, supplier databases, cost curves, and analyst-backed insights across chemicals, agriculture, energy, packaging, and more. Use these tools to benchmark your contracts, plan budgets with confidence, and stay ahead of market moves on every product you buy.

0

+

Products

0

+

Regions

0

+

Subscriptions

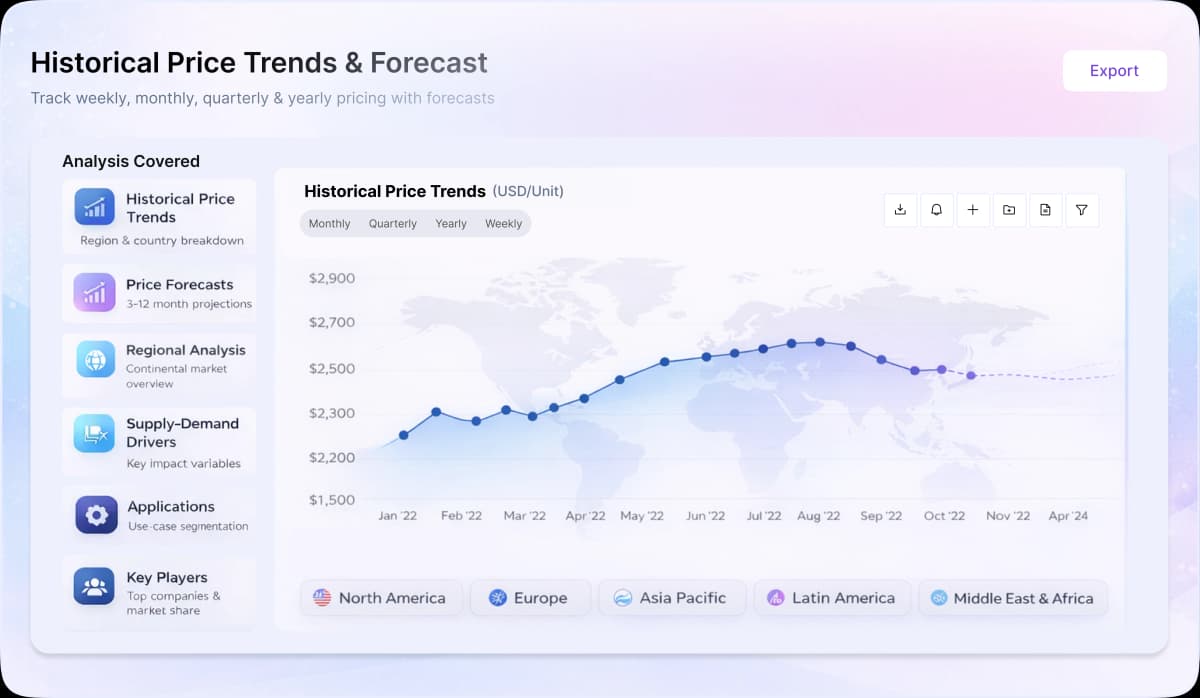
Calcium Alginate prices kept on vacillating in accordance with the fluctuations in the prices of its feedstock material seaweed, but the overall market outlook was still very firm throughout. Tanzania, the biggest seaweed producer, registered a record 52% year-on-year growth in the seaweed yield in the third quarter. This essentially reduced the production costs of calcium alginate and reduced the upstream cost support, imparting a slide in the calcium alginate price trend.

The downstream demands from the food and medicine industries also remained steady, and the inventories were also stocked sufficiently. All these factors dictated an average performance of the calcium alginate market throughout the second half of the year 2023.

About Calcium Alginate

Alginate is usually referred to as the salts of alginic acid and can exist as calcium, magnesium, and sodium salts and is often referred to as algin. Calcium alginate is a water-insoluble, gelatinous substance prepared by adding aqueous calcium chloride to sodium alginate. It is non-toxic and is generally recognized as safe in food. It is often used as hydrogels, dental impressions materials, absorbents, etc.

Calcium Alginate Product Detail

HS Code
39131000
Chemical Formula

C18H24CaO19

CAS Number
9005-35-0
Molecular Weight
584.4 g/mol
Synonyms

Alginic Acid, Calcium Salt

Supplier Database

DuPont de Nemours, Inc, Marine Biopolymers Limited, Shandong Jiejing Group Corporation, Algaia, KIMICA, Ceamsa

Regional Coverage

Asia Pacific

China, India, Indonesia, Pakistan, Bangladesh, Japan, Philippines, Vietnam, Iran, Thailand, South Korea, Iraq, Saudi Arabia, Malaysia, Nepal, Taiwan, Sri Lanka, UAE, Israel, Hongkong, Singapore, Oman, Kuwait, Qatar, Australia, and New Zealand

Europe

Germany, France, United Kingdom, Italy,Spain, Russia, Turkey, Netherlands, Poland, Sweden, Belgium, Austria, Ireland Switzerland, Norway, Denmark, Romania, Finland, Czech Republic, Portugal and Greece

North America

United States and Canada

Latin America

Brazil, Mexico, Argentina, Columbia, Chile, Ecuador, and Peru

Africa

South Africa, Nigeria, Egypt, Algeria, Morocco

CurrencyUS$ (Data can also be provided in local currency)

Supplier Database AvailabilityYes

Customization ScopeThe report can be customized as per the requirements of the customer

Post-Sale Analyst Support360-degree analyst support after report delivery

Note: Our supplier search experts can assist your procurement teams in compiling and validating a list of suppliers indicating they have products, services, and capabilities that meet your company's needs.

Calcium Alginate Production Processes

  • Production of Calcium Alginate from Extraction Process

The seaweed is broken into pieces to extract the alginate and stirred with a hot sodium carbonate solution. It then separates as a thick slurry of sodium alginate. The slurry is then diluted with water and subjected to many filtration processes to remove the impurities. Then the sodium alginate is treated with an aqueous solution of calcium chloride; thus, the required product calcium alginate separates from the solution.

Frequently Asked Questions

The calcium alginate outlook remains tied to South Korea's dominance of over 70% of the global dried seaweed market, which leaves supply exposed to ocean-temperature rises and marine desertification, compounded by structurally declining wakame harvests in Japan. Surging US demand for Korean seaweed adds further upward pressure on feedstock. South Korea's planned farming-area expansion and research into high-temperature-resistant seaweed variants could improve resilience over time, but an aging fishing workforce limits how quickly that expansion can translate into added supply, keeping the market prone to periodic tightness.
Ocean-temperature rises and marine desertification are the central supply risk, since South Korea supplies over 70% of the global dried seaweed market that underpins calcium alginate production. Japan's wakame harvests, concentrated in the Sanriku region, face structurally declining yields, further tightening raw-material availability. Growing US demand for Korean seaweed amplifies pressure on an already constrained supply base. An aging fishing workforce in key farming regions limits how quickly planned area expansions can add capacity, making labor availability a persistent structural constraint on supply growth.
Calcium alginate is produced from brown seaweed harvested in South Korea, China, Norway, Chile, and Japan, processed into sodium alginate and cross-linked with calcium chloride. Key suppliers include DuPont de Nemours, Marine Biopolymers Limited, Shandong Jiejing Group, Algaia, KIMICA, and Ceamsa. The United States is a growth market driven by rising demand for Korean seaweed in food and wound-care. South Korea commands over 70% of the global dried seaweed market, but rising ocean temperatures and marine desertification threaten harvests, making feedstock availability the vulnerability for manufacturers worldwide.
Calcium alginate is produced from brown seaweed, the natural source of alginic acid. The seaweed is stirred with hot sodium carbonate to extract sodium alginate, which is then reacted with aqueous calcium chloride to form water-insoluble calcium alginate gel. On average, 15 to 25 MT of wet seaweed yields 1 MT of sodium alginate, with roughly 0.85 to 1.10 MT of sodium alginate and 0.15 to 0.30 MT of calcium chloride required per MT of finished product.
Calcium alginate demand in food and beverage is driven by its use as a gelling and thickening agent, stabilizer, and in edible gels that encapsulate flavors. As food manufacturers increase production of products relying on these functional properties, procurement volumes rise, adding direct price pressure. This demand pull intersects with constrained seaweed supply, since South Korea commands over 70% of the global dried seaweed market while Japan's wakame harvests face structural decline, tightening raw material availability and sustaining upward price pressure over time.
Ocean-temperature stress and marine desertification are the main seasonal and structural pressure points on calcium alginate prices, since they cut dried-seaweed output in South Korea, which supplies over 70% of the global market. Japan's wakame harvests in the Sanriku coastal region face a similar structural decline, compounding the squeeze. Demand surges from the United States for Korean seaweed amplify any imbalance, while an aging fishing-village workforce constrains harvesting capacity even as farming areas expand. Gradual stabilization depends on South Korea's area expansion and development of high-temperature-resistant seaweed variants.
Calcium alginate is supplied as a white to cream-colored granular powder or fibrous solid, manufactured in forms including powder, fiber, bead, or sheet to suit end-use. Food-grade material carries E404 approval in the EU for gelling, thickening, stabilizing, and flavor encapsulation. Pharmaceutical and biomedical grades are ultra-pure forms used for drug delivery, wound dressings, and tissue engineering. Industrial grades serve textile and water-treatment roles. The grade distinction matters commercially because purity thresholds and regulatory compliance requirements vary sharply across sectors, directly affecting procurement cost and market access.
Procurement Resource assesses calcium alginate prices through a structured, data-driven methodology that combines primary engagement with producers, suppliers and traders, secondary market data, monitoring of feedstock and input costs, trade-flow and inventory tracking, and exchange or spot benchmarks. These inputs are validated and translated into a transparent price assessment and outlook. The detailed methodology is available on the Procurement Resource website.

Our Price Analysis Methodology

About the Author

Siddharth David profile photo

Siddharth David

Manager - Market Research

Delivering market research and procurement intelligence at Procurement Resource with a focus on economic forecasting, commodity analysis, and client advisory to help sourcing teams make data-backed purchasing decisions.

Schedule Demo

Schedule A Demo

Experience how Procurement Resource transforms raw material price data into clear, decision ready intelligence. Optimise your performance with reliable, expert market data and analysis. Schedule your demo today to experience a live walk-through where our experts will showcase interactive price charts, forecasted prices, and insights driving the prices for your key commodities, tailored to your workflows. Contact us now!

Our Team will be happy to assist you

We are just a text away

+1

Still Need Help?

Europe & Africa

+44 7573 171117

Sales@procurementresource.com

USA & Canada

+1 307 363 1045

Sales@procurementresource.com

APAC

+91 8850629517

Sales@procurementresource.com

Unlock full access to Procurement Resource's price databases, interactive charts, and short-term forecasts for thousands of commodities. Elevate your sourcing decisions by comparing prices across regions, downloading historical data, and layering in analyst-backed insights, all with our flexible plans that scale as your portfolio grows.

Still have any Questions

Contact Us
Mastercard
Wire
VISA
Stripe

Why Procurement Database

Commodity Market Intelligence

Commodity Market Intelligence

Track prices, market movements, supply-demand dynamics, and industry developments across hundreds of commodities through a centralized intelligence platform built for informed procurement decisions.

Price Forecasts & Market Outlooks

Price Forecasts & Market Outlooks

Understand market fluctuations using analyst-backed forecasts, historical pricing patterns, and evolving industry trends to strengthen sourcing strategies and budget planning.

Cost & Procurement Optimization

Cost & Procurement Optimization

Leverage cost models, pricing benchmarks, and procurement insights to evaluate purchasing opportunities, improve negotiations, and enhance operational efficiency.

Global & Regional Market Insights

Global & Regional Market Insights

Access region-specific price trends, trade activities, capacity changes, and supply chain developments influencing commodity markets worldwide.

1/4