Product
Activated Carbon Price Trend and Forecast
Activated Carbon Price Trend and Forecast
Activated Carbon Regional Price Overview
Get the latest insights on price movement and trend analysis of Activated Carbon in different regions across the world (Asia, Europe, North America, Latin America, and the Middle East & Africa).
Activated Carbon Price Trend for the Year 2024
Asia
In 2024, the activated carbon market in Asia demonstrated steady growth, fuelled by increasing industrial demand and the region’s focus on environmental standards. China, as both the largest producer and consumer of activated carbon, experienced significant growth in its market. This was primarily driven by the country's stringent environmental policies, which pushed industries to adopt better air and water filtration solutions. India also saw an uptick in demand, with industries such as water treatment, textiles, and pharmaceuticals increasing their consumption of activated carbon.
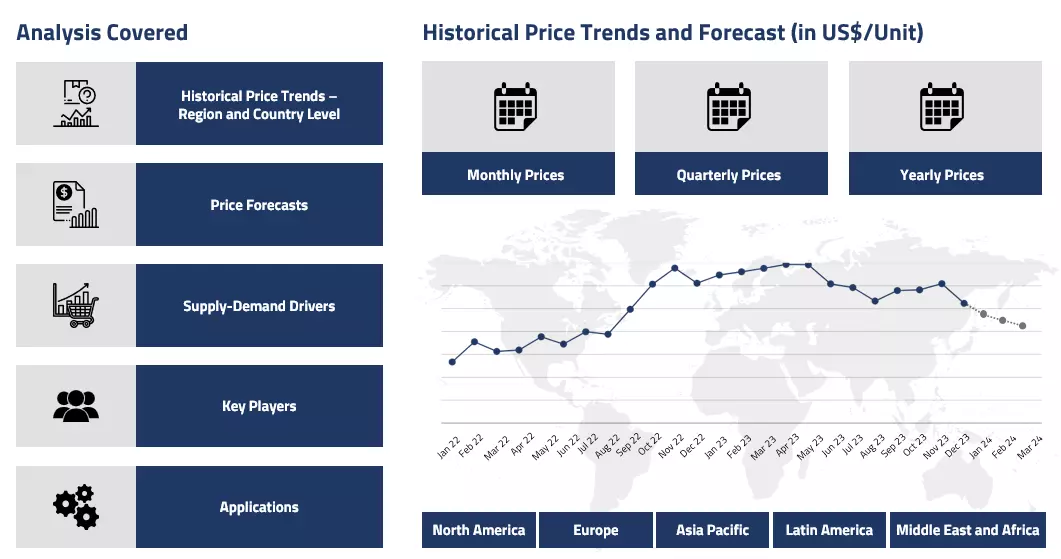
Activated Carbon Price Chart

Please Login or Subscribe to Access the Activated Carbon Price Chart Data
Furthermore, Japan's market remained stable, with steady demand for applications in air filtration and the automotive sector, although growth was not as rapid as in China and India. The overall growth trend in the region was further supported by the government's efforts to reduce pollution levels, which made activated carbon a key solution in various environmental control processes. However, price fluctuations and raw material shortages posed challenges to the market in certain months.
Europe
In Europe, the activated carbon market experienced mixed performance throughout 2024. Western European countries like Germany, France, and the UK saw robust demand, particularly in industries such as automotive, water purification, and air filtration. Strict environmental regulations across the European Union played a significant role in pushing businesses to adopt more sustainable filtration solutions, driving up the demand for activated carbon.
However, some challenges emerged, including economic slowdowns in certain parts of the region and fluctuations in industrial output, which dampened overall growth. Eastern Europe’s market growth was slower, with less industrial investment in environmental technologies compared to Western Europe. Nonetheless, sectors like chemical processing and wastewater treatment still contributed to market stability.
North America
In North America, the activated carbon market showed steady but moderate growth in 2024. The United States remained the largest consumer, with demand driven by regulatory pressures to improve air and water quality. Stricter pollution control laws in states like California and New York continued to fuel the adoption of activated carbon for air filtration systems, water treatment plants, and industrial applications. The power generation sector, especially coal-fired plants, also remained a key driver of demand, although environmental shifts toward cleaner energy slightly reduced reliance on activated carbon in some areas.
Canada experienced more modest growth, with demand mostly driven by water treatment and air purification systems. Environmental initiatives in major cities supported increased consumption, but overall demand growth was slower compared to the US. Additionally, supply chain disruptions impacted the North American market, particularly in the first half of 2024, creating some shortages and delays in meeting demand.
Analyst Insight
According to Procurement Resource, the outlook for the activated carbon market remains positive across all regions. As the global focus on sustainability and cleaner technologies intensifies, activated carbon’s role in pollution control and filtration will become even more crucial, ensuring continued market growth despite occasional supply chain hurdles.
Activated Carbon Price Trend for the Second Half of 2023
Asia
After a slumping run in the first half, the activated carbon market prices finally started to improve as the third quarter began. The inventories started to run out, promoting the activated carbon imports. A substantial rise in the feedstock coal prices also pushed the price trend up for activated carbon. Suppliers increased procurement from the international markets as well. Though there was some variation within the region, the market sentiments were more or less high.
A rise in crude oil prices also provided additional support to the activated carbon price trend. As the fourth quarter approached, the market was able to sustain its momentum; however, subtly, the constant overflow of inventories started to take over the market demands. Crude oil prices also started to decline, and thus, the price trajectory pivoted in the reverse direction. Overall, the market performance was fine throughout the said period.
Europe
The European activated carbon market struggled more compared to its Asian counterpart; the prices here were observed to be fluctuating within a narrow range for the entire span of H2’23. The downstream sector was primarily responsible for pushing the activated carbon price graph down here.
The demands were not at all supportive, so the suppliers were forced to discount the prices in order to promote stock movement, but the consumption was still largely underwhelming. Despite a rise in the upstream costs, the activated carbon price trend could not rise. Though the situation did reverse in the first half of the fourth quarter, the growth could not be sustained as the prices again dwindled as the year-end approached.
North America
In the North American market, the prices began with a stable trajectory with a narrowed gap between the supply and demand dynamics; however, steadily, the demands started to tumble down owing to sufficient inventory support in the downstream industries. This led to a fall in the price graph, which started in mid-Q3 and continued till the middle of Q4. It was only after that the demand picked up again, and the prices started to rise again in the American market.
Analyst Insight
According to Procurement Resource, the Activated Carbon price trend is expected to marginally lose its growth in the coming months. The inventories are overfilled, and the demands are not able to keep up, so the market is likely to fall momentarily going forward.
Activated Carbon Price Trend for the First Half of 2023
Asia
The activated carbon market declined in the first two quarters of 2023. The demand from the downstream industries and cost support from the automotive and tire sectors declined significantly in the Asia-Pacific region. The hike in inventory levels, which were a direct effect of subdued demand and market fluctuations, fueled the dip in activated carbon prices.
Europe
In Europe, the price trend of activated carbon was guided by the poor performance of the downstream industries, with significant fluctuations in the automotive and tire industries. The congestion at ports and supply chain bottlenecks also aided the fall in activated carbon prices in the first half of 2023.
North America
The price of activated carbon in the first two quarters had a fluctuating trajectory. In the initial months, the prices declined significantly due to the instability in the automotive market and financial uncertainties brought by the closure of two major banks leading to extreme economic conditions in the North American region. However, in the second quarter, the prices saw an uprising trend as the demand for the commodity improved in both domestic and international sectors.
Analyst Insight
According to Procurement Resource, the price of activated carbon is expected to showcase a mixed trend in the upcoming months. Given the current uncertainties, prices will closely follow the interplay between the supply-demand dynamics.
Activated Carbon Price Trend for the Second Half of 2022
The price trend for activating carbon registered a fluctuating pattern during the said period. In China, at the beginning of the third quarter, the price of activated carbon averaged 12500 RMB/MT ( approx.). However, the prices soon began to fall owing to deserted market offtakes and transactions. In August the price of activated carbon averaged 10,833 USD/MT.
The operating rates of industries in China were also reduced on government orders to handle the frequent heatwaves and power consumption. To cushion their profits manufacturers looked for increasing the capacity of activated carbon by enhancing its profits. Later towards the end of the said quarter, the market demand recovered slightly, and the prices rose averaging 10,866 RMB/MT.
In India, the same pricing trend continued. The activated carbon prices witnessed a slight incline in Q3 averaging around 2890 USD/MT (FOB coconut shell based) (approx.). However, soon the momentum fizzled out and the prices declined. The same downward trajectory continued in the fourth quarter with prices averaging 2620 USD/MT ( FOB coconut shell based) (approx.) in December’22.
Analyst Insight
Given the current market dynamics the prices of activated carbon are expected to incline in the coming months. The stabilizing market pricing fundamentals and logistics amid rising demand will cause the prices to rise.
Activated Carbon Price Trend For the Second Quarter of 2022
Asia
With the emergence of Covid-19, a massive surge in the price of activated charcoal is seen due to the increasing demands for masks and other primary protection gears. The price trend for activated carbon is steadily rising in Asia, averaging 10700 RMB/MT.
Europe
Activated carbon prices are steadily increasing within the EU due to the ongoing conflicts and the inflated crude oil and freight charges. The price of primary feedstock carbon reached around 91 USD/MT, which again caused a surge in the price of activated carbon.
Activated Carbon Price Trend For the First Quarter of 2022
Asia
Per ton price of activated carbon was 10266.67 RMB/MT towards the end of March. Due to severe air quality standards and a growth in the number of municipal and industrial wastewater treatment plants, the demand for activated carbon had skyrocketed. The rising pressure on the manufacturers due to the high production cost of the mineral was a prominent factor in the business.
As a result, reactivated carbon was a major priority for activated carbon manufacturers. The cost of reactivated carbon is 20-30% less than that of fresh activated carbon. It is a less expensive alternative to activated carbon. Traditional activated carbon is more environmentally friendly than reactivated carbon. When compared to the manufacture of virgin material, the thermal reactivation method reduces carbon dioxide emissions by five times.
Procurement Resource provides latest prices of Activated Carbon. Each price database is tied to a user-friendly graphing tool dating back to 2014, which provides a range of functionalities: configuration of price series over user defined time period; comparison of product movements across countries; customisation of price currencies and unit; extraction of price data as excel files to be used offline.
About Activated Carbon
Activated carbon, better known as the activated charcoal, is a form of carbon processed to have tiny, low-volume pores, thus, enhancing the surface area available for chemical reactions. An activation level sufficient for useful applications might be derived solely from the high surface area. Further chemical treatment often enhances the product's adsorption properties.
Activated Carbon Product Details
| Report Features | Details |
| Product Name | Activated Carbon |
| Industrial Uses | Water treatment, Air Treatment, Respirators, Gold Treatment, Solvency Recovery |
| Synonyms | Activated Charcoal |
| Supplier Database | Kuraray Co., Ltd., Oxbow Activated Carbon LLC, Haycarb (Pvt) Ltd., Indo German Carbons Limited (IGCL), Shinkwang Chem. Ind. Co., Ltd, Century Chemical Works Sdn. Bhd, Cabot Corporation |
| Region/Countries Covered | Asia Pacific: China, India, Indonesia, Pakistan, Bangladesh, Japan, Philippines, Vietnam, Iran, Thailand, South Korea, Iraq, Saudi Arabia, Malaysia, Nepal, Taiwan, Sri Lanka, UAE, Israel, Hongkong, Singapore, Oman, Kuwait, Qatar, Australia, and New Zealand Europe: Germany, France, United Kingdom, Italy, Spain, Russia, Turkey, Netherlands, Poland, Sweden, Belgium, Austria, Ireland Switzerland, Norway, Denmark, Romania, Finland, Czech Republic, Portugal, and Greece North America: United States and Canada Latin America: Brazil, Mexico, Argentina, Columbia, Chile, Ecuador, and Peru Africa: South Africa, Nigeria, Egypt, Algeria, Morocco |
| Currency | US$ (Data can also be provided in local currency) |
| Supplier Database Availability | Yes |
| Customization Scope | The report can be customized as per the requirements of the customer |
| Post-Sale Analyst Support | 360-degree analyst support after report delivery |
Note: Our supplier search experts can assist your procurement teams in compiling and validating a list of suppliers indicating they have products, services, and capabilities that meet your company's needs.
Activated Carbon Production Processes
- Production of Activated Carbon from Coal
The production of activated carbon involves carbonization and activation. The carbonization process involves drying and then heating coal to separate byproducts such as tars and other hydrocarbons and to drive off any gases produced.
To complete the carbonization process, the carbonaceous material is heated at 400-600°C in an oxygen-deficient atmosphere that cannot support combustion. This process is followed by activation using a chemical or a physical process to obtain activated carbon as the final product.
Methodology
The displayed pricing data is derived through weighted average purchase price, including contract and spot transactions at the specified locations unless otherwise stated. The information provided comes from the compilation and processing of commercial data officially reported for each nation (i.e. government agencies, external trade bodies, and industry publications).
Assistance from Experts
Procurement Resource is a one-stop solution for businesses aiming at the best industry insights and market evaluation in the arena of procurement. Our team of market leaders covers all the facets of procurement strategies with its holistic industry reports, extensive production cost and pre-feasibility insights, and price trends dynamics impacting the cost trajectories of the plethora of products encompassing various industries. With the best analysis of the market trends and comprehensive consulting in light of the best strategic footstep, Procurement Resource got all that it takes.
Client's Satisfaction
Procurement Resource has made a mark for itself in terms of its rigorous assistance to its clientele. Our experienced panel of experts leave no stone unturned in ensuring the expertise at every step of our clients' strategic procurement journey. Our prompt assistance, prudential analysis, and pragmatic tactics considering the best procurement move for industries are all that sets us apart. We at Procurement Resource value our clients, which our clients vouch for.
Assured Quality
Expertise, judiciousness, and expedience are the crucial aspects of our modus operandi at Procurement Resource. Quality is non-negotiable, and we don't compromise on that. Our best-in-class solutions, elaborative consulting substantiated by exhaustive evaluation, and fool-proof reports have led us to come this far, making us the ‘numero uno' in the domain of procurement. Be it exclusive qualitative research or assiduous quantitative research methodologies, our high quality of work is what our clients swear by.
Table Of Contents
Our Clients

Get in Touch With Us

UNITED STATES
Phone:+1 307 363 1045

INDIA
Phone: +91 8850629517

UNITED KINGDOM
Phone: +44 7537 171117
Email: sales@procurementresource.com

