Product
Depreciation Rates Price Trend and Forecast
Depreciation Rates Price Trend and Forecast
Depreciation Rates Regional Price Overview
Get the latest insights on price movement and trend analysis of Depreciation Rates in different regions across the world (Asia, Europe, North America, Latin America, and the Middle East & Africa).
Depreciation Rates Price Trend for the Year 2023
Depreciation is used to waver the costs of an asset past its useful life. It is a compulsory reduction in the profit and loss statement of the owner of these depreciable assets. Various tangible (building, machinery, plant, or furniture) and intangible (patents, copyrights, trademarks, etc.) assets have been grouped under the depreciable block. For residential buildings, not including boarding houses and hotels, a 5% depreciation rate is assigned, while for hotels and boarding houses, a 10%, and for temporary constructions like wooden buildings, a 40% depreciation rate is assigned.
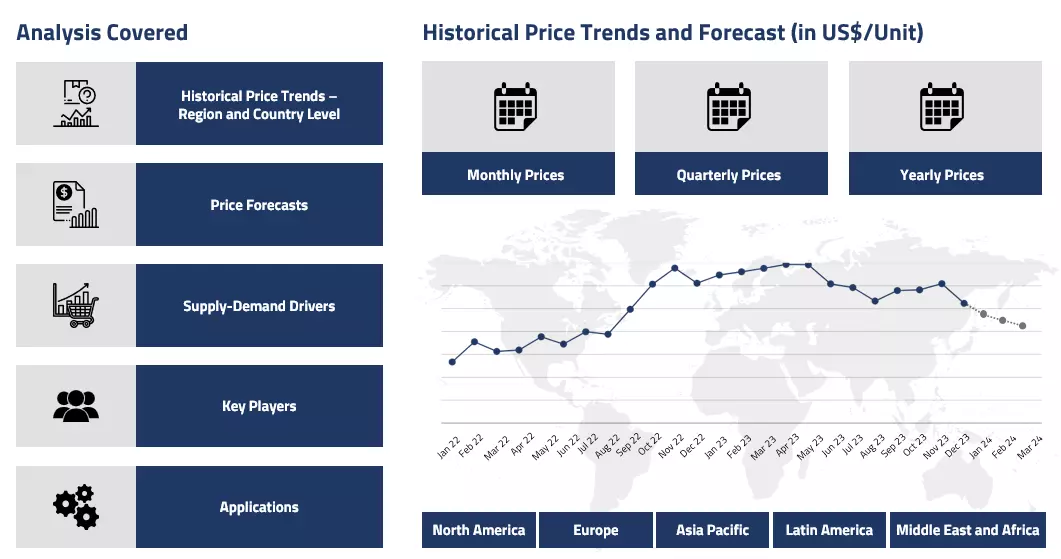
Depreciation Rates Price Chart

Please Login or Subscribe to Access the Depreciation Rates Price Chart Data
For furniture, a 10%; for plants and machinery, excluding motor vehicles, 15-30% depreciation, while for motor vehicles, a 30–45% depreciation depending on their purchase and age is assigned. For computers, proposal software, and other software, 40%, while for books in annual publications, a 100% depreciation is allowed. For intangible assets, a depreciation of up to 25% is allowed.
Depreciation Rates Price Trend for the Year 2022
Depreciation is defined as the reduction in the value of assets over time due wear and tear. As per the Income Tax Act for AY 2022-23, no depreciation will be allowed if an asset is acquired in cash more than 10,000 INR in a day. However, a depreciation claim can be filed if the amount is up to 10,000 INR a day. The government came out with the list of commodities and the depreciation allowance as the percentage of the written down cost.
The building used for residential purposes other than hotels incurs a total of 5% depreciation allowance, whereas machinery and production plants, if not specified otherwise, incur an allowance of 15%. Similarly, moulds used in the rubber and polymer industry incur a depreciation allowance of 30%, while the machinery required in garment processing industries incurs a depreciation allowance of 40%.
Depreciation rates have been significant all through a wide range of products as in temporary constructions (wood structures, furniture, aesthetic designs, etc.). The depreciation incurrence on this class of products have witnessed a significant 40 %. Along the similar lines, electrical fixtures along with fittings and different furniture saw a depreciation dip of around 10 %.
Aeroplanes and Aeroengines incurred a depreciation of 40 %. Moreover, equipment catering to air pollution control such as Felt filtering system, scrubbers, dust collection, etc. incurred a depreciation of 40 %.
Procurement Resource provides latest Depreciation Rates. Each price database is tied to a user-friendly graphing tool dating back to 2014, which provides a range of functionalities: configuration of price series over user defined time period; comparison of product movements across countries; customisation of price currencies and unit; extraction of price data as excel files to be used offline.
About Depreciation Rates
A depreciation rate refers to the percent rate at which an asset is depreciated or deflated across its estimated life. It may also be known as the percentage of a long-term investment done in an asset by a company, which the company can claim as tax-deductible expense across the useful life of the asset.
Depreciation Rates Product Details
| Report Features | Details |
| Product Name | Depreciation Rates |
| Region/Countries Covered | Asia Pacific: China, India, Indonesia, Pakistan, Bangladesh, Japan, Philippines, Vietnam, Iran, Thailand, South Korea, Iraq, Saudi Arabia, Malaysia, Nepal, Taiwan, Sri Lanka, UAE, Israel, Hongkong, Singapore, Oman, Kuwait, Qatar, Australia, and New Zealand Europe: Germany, France, United Kingdom, Italy, Spain, Russia, Turkey, Netherlands, Poland, Sweden, Belgium, Austria, Ireland Switzerland, Norway, Denmark, Romania, Finland, Czech Republic, Portugal and Greece North America: United States and Canada Latin America: Brazil, Mexico, Argentina, Columbia, Chile, Ecuador, and Peru Africa: South Africa, Nigeria, Egypt, Algeria, Morocco |
| Currency | US$ (Data can also be provided in local currency) |
| Supplier Database Availability | Yes |
| Customization Scope | The report can be customized as per the requirements of the customer |
| Post-Sale Analyst Support | 360-degree analyst support after report delivery |
Note: Our supplier search experts can assist your procurement teams in compiling and validating a list of suppliers indicating they have products, services, and capabilities that meet your company's needs.
Methodology
The displayed pricing data is derived through weighted average purchase price, including contract and spot transactions at the specified locations unless otherwise stated. The information provided comes from the compilation and processing of commercial data officially reported for each nation (i.e. government agencies, external trade bodies, and industry publications).
Assistance from Experts
Procurement Resource is a one-stop solution for businesses aiming at the best industry insights and market evaluation in the arena of procurement. Our team of market leaders covers all the facets of procurement strategies with its holistic industry reports, extensive production cost and pre-feasibility insights, and price trends dynamics impacting the cost trajectories of the plethora of products encompassing various industries. With the best analysis of the market trends and comprehensive consulting in light of the best strategic footstep, Procurement Resource got all that it takes.
Client's Satisfaction
Procurement Resource has made a mark for itself in terms of its rigorous assistance to its clientele. Our experienced panel of experts leave no stone unturned in ensuring the expertise at every step of our clients' strategic procurement journey. Our prompt assistance, prudential analysis, and pragmatic tactics considering the best procurement move for industries are all that sets us apart. We at Procurement Resource value our clients, which our clients vouch for.
Assured Quality
Expertise, judiciousness, and expedience are the crucial aspects of our modus operandi at Procurement Resource. Quality is non-negotiable, and we don't compromise on that. Our best-in-class solutions, elaborative consulting substantiated by exhaustive evaluation, and fool-proof reports have led us to come this far, making us the ‘numero uno' in the domain of procurement. Be it exclusive qualitative research or assiduous quantitative research methodologies, our high quality of work is what our clients swear by.
Table Of Contents
Our Clients

Get in Touch With Us

UNITED STATES
Phone:+1 307 363 1045

INDIA
Phone: +91 8850629517

UNITED KINGDOM
Phone: +44 7537 171117
Email: sales@procurementresource.com

