Need latest Labour Wages prices?
Get real-time price assessments, periodic trends, forecasts and price driver insights across key global markets.
Unlock Price Insights NowIn Q3’25, the US labour market showed clear signs of weakening, and this was reflected in wage trends. Although average hourly wages increased over the year, the pace of growth slowed, and real wages (adjusted for inflation) actually fell in August.
Between July and August, earnings dipped slightly after accounting for rising consumer prices, suggesting that inflation was moving faster than wage growth. This imbalance affected workers’ purchasing power.
The job market itself cooled significantly during the quarter. Unemployment also rose to the highest level in nearly four years. These trends made employers more cautious about raising wages, as businesses faced increased costs from tariffs and reduced confidence due to political uncertainty and global economic pressure.
Sectors like manufacturing, construction, and government saw job cuts, which further weighed on overall wage growth. Additionally, the decline in immigration meant fewer new workers entering the job market, but that still didn’t create enough competition to drive up wages. Youth unemployment rose sharply, adding further strain to the labour environment. At the same time, the Federal Reserve’s interest rate decisions and inflation management added pressure. With expectations for rate cuts rising, markets remained focused on economic support, not wage inflation.
Get real-time price assessments, periodic trends, forecasts and price driver insights across key global markets.
Unlock Price Insights Now
Turn price intelligence into action with the Procurement Resource Database. Log in or subscribe to unlock live price trends, historical charts, supplier databases, cost curves, and analyst-backed insights across chemicals, agriculture, energy, packaging, and more. Use these tools to benchmark your contracts, plan budgets with confidence, and stay ahead of market moves on every product you buy.

0
+Products
0
+Regions
0
+Subscriptions
In the first half of 2025, labour costs followed a mixed trend globally, shaped by shifting economic conditions, inflationary pressures, and uneven recovery across regions. Many advanced economies saw slight increases in real wages, especially where inflation had eased, and productivity had improved. However, the gains were not universal. In most low-income countries, wage growth remained stagnant, as weak employment creation and declining labour force participation weighed down labour market performance.
Young people, particularly in low- and middle-income regions, continued to face high unemployment, further limiting wage pressure from that demographic. Informal employment remained high, especially in developing economies, with working poverty returning to pre-pandemic levels. This limited overall wage improvements as many workers remained outside formal protection or wage structures.
In countries like India, wage structures stayed complex and varied across states. Labour costs remained competitive but faced upward pressure due to inflation adjustments and skill-based wage revisions. While minimum wage enforcement remained a challenge, discussions around implementing a national living wage continued, signalling a potential shift in future wage floors.
At the same time, high-income countries experienced increased labour force participation among older workers and women, contributing to stable wage levels. However, gender gaps persisted, especially in access to formal employment, which constrained labour market inclusiveness and wage equality.
This refers to the manpower required to operate the chemical plant. The cost is estimated from an average of the number of shifts and days a personnel is required, based on his/her experience with similar processes. In general, chemical plants do not employ many people and the direct overhead charges would add 21 to 32% to the plant operation cost.

CurrencyUS$ (Data can also be provided in local currency)
Supplier Database AvailabilityYes
Customization ScopeThe report can be customized as per the requirements of the customer
Post-Sale Analyst Support360-degree analyst support after report delivery
Note: Our supplier search experts can assist your procurement teams in compiling and validating a list of suppliers indicating they have products, services, and capabilities that meet your company's needs.
Our Price Analysis Methodology

Experience how Procurement Resource transforms raw material price data into clear, decision ready intelligence. Optimise your performance with reliable, expert market data and analysis. Schedule your demo today to experience a live walk-through where our experts will showcase interactive price charts, forecasted prices, and insights driving the prices for your key commodities, tailored to your workflows. Contact us now!
Our Team will be happy to assist you
We are just a text away
Still Need Help ?
This report provides the cost structure for modified starch using chemical modification.
Unlock full access to Procurement Resource's price databases, interactive charts, and short-term forecasts for thousands of commodities. Elevate your sourcing decisions by comparing prices across regions, downloading historical data, and layering in analyst-backed insights, all with our flexible plans that scale as your portfolio grows.
Still have any Questions
Contact Us


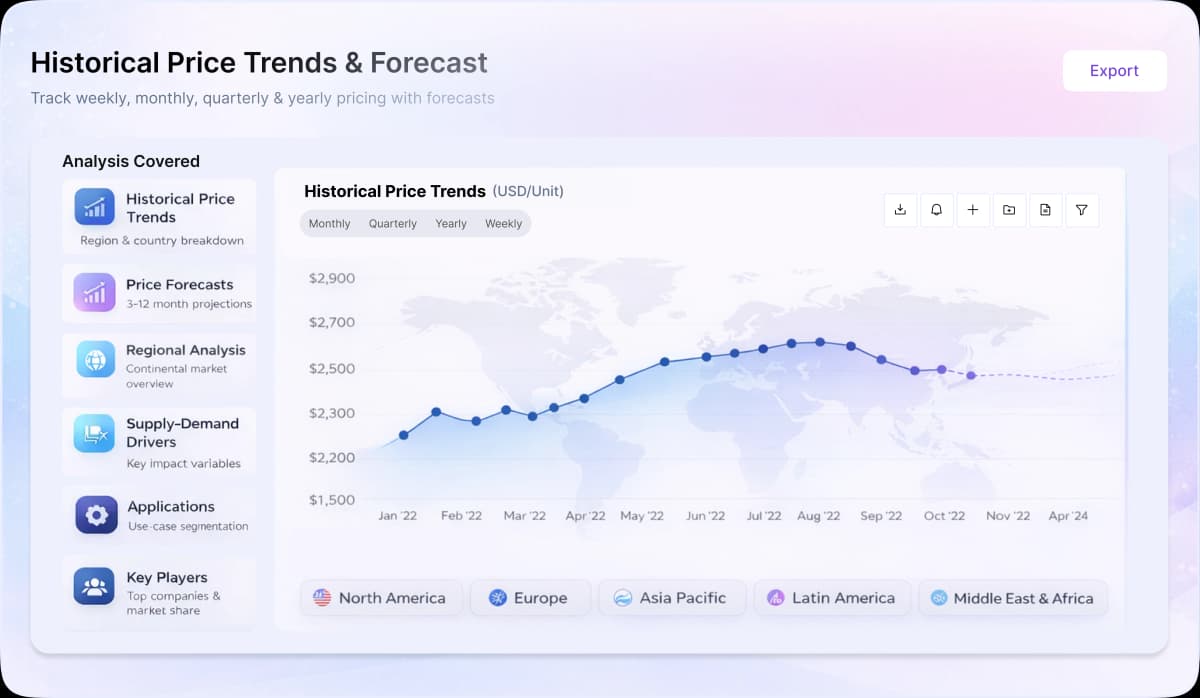
Price Trend Dashboard - What's Included
Price trends across a diverse portfolio of categories and products, spanning board to niche chemicals
Coverage extendable to grade-specific chemicals based on procurement requirements
Regular price tracking supported by robust historical datasets
News, policy updates, and key market drivers impacting price movements
Short-term and long-term price outlooks and forecasts
Supply–demand dynamics and capacity-driven market analysis