Product
Malonic Acid Price Trend and Forecast
Malonic Acid Price Trend and Forecast
Malonic Acid Regional Price Overview
Get the latest insights on price movement and trend analysis of Malonic Acid in different regions across the world (Asia, Europe, North America, Latin America, and the Middle East & Africa).
Malonic Acid Price Trend for the First Half of 2024
During the first half of 2024, the price trend of malonic acid in Asia was strongly influenced by the fluctuations in its feedstock. The appreciation of the yuan against the US dollar enhanced the competitiveness of Chinese exports, driving up malic acid export volumes and leading to a tighter domestic market. This created a ripple effect on malonic acid prices, as suppliers faced increased costs and demand pressures.
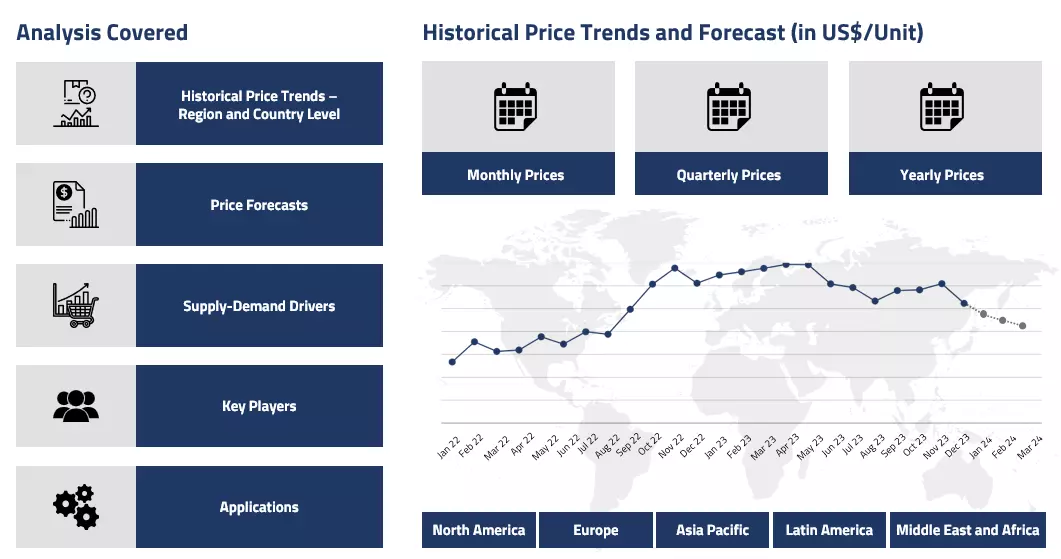
Malonic Acid Price Chart

Please Login or Subscribe to Access the Malonic Acid Price Chart Data
The geopolitical tensions in the region disrupted traditional trade flows, leading to cargo scarcity and further straining supply chains, which ultimately contributed to rising prices of malonic acid. Moreover, domestic demand for both malic and malonic acids remained strong, with local manufacturers experiencing a surge in inquiries from international markets, exacerbating the supply-demand imbalance. The scheduled maintenance shutdowns at several key production facilities in China compounded the supply shortages, creating additional upward pressure on malonic acid prices.
Feedstock malic acid faced rising costs due to elevated prices of maleic anhydride, which itself was driven by higher feedstock benzene prices influenced by strengthening global crude oil markets. These upstream cost pressures flowed through to the malonic acid market, leading to increased manufacturing costs and reduced availability of the product. Additionally, inventory levels of malonic acid remained low throughout the period, further fueling price hikes as manufacturers struggled to meet demand.
With limited alternatives and ongoing logistical challenges, including higher transportation costs and delays in shipments, the malonic acid market in Asia faced persistent upward price pressure throughout the first half of the year. This reflected the broader dynamics of the malic acid supply chain, as both domestic and export markets experienced significant price escalations due to constrained supply and rising input costs.
Analyst Insight
According to procurement resources, the price of Malonic Acid is estimated to showcase a slight recovery in the months ahead on the back of surging production costs.
Malonic Acid Price Trend for the Second Half of 2023
Malonic acid is produced primarily with the help of chloroacetic acid and sodium cyanide. So, the price dynamic of malonic acid is greatly tilted towards the feedstock prices generally. During the last two quarters of 2023 as well, the prices were found to be influenced by these raw material costs; however, along with that, there were also several other factors responsible for the resulting wavering price trajectory.
Europe was seeing a manufacturing recession as the grappling economy, after facing the dire Covid-19 pandemic, could not support the markets much. The Russia-Ukraine war was still consequential when the Israel-Hamas war also broke out. The trade started to decline through the Suez Canal as well which acts as the most prominent maritime gateway between Europe and Asia.
The malonic acid market mostly remained tugged as the prices pivoted in both upward and downward directions. Overall, narrow-ranged fluctuations were seen in the malonic acid prices during the said period.
Analyst Insight
According to Procurement Resource, not much change is anticipated in the Malonic Acid prices going forward since the supply and demand outlooks are most likely to sustain their current momentum.
Malonic Acid Price Trend for First Half of 2023
The price trend of malonic acid in 2023 witnessed a notable increase in the first two quarters of 2023. This upward trajectory can be attributed to several key factors. One significant driver was the reduction in malonic acid production in India. The decline in the rates of production was not only limited to India, but key regions like Europe, China, and Thailand also stood on the same front.
Further, in India, the demand from consumers remained high throughout this phase and, thus, is one of the significant contributors to the rise in the prices of malonic acid. The export rates also surged as the demand increased in the overseas industries too.
Overall, the price trend of malonic acid has been shaped by multiple factors, including decreased Indian production, limited global supply, and Indian export dynamics, all contributing to the rising malonic acid prices.
Analyst Insight
According to Procurement Resource, the price trend for Malonic Acid are expected to fluctuate with the demand from the consumers and the rate of production.
Procurement Resource provides latest prices of Malonic Acid. Each price database is tied to a user-friendly graphing tool dating back to 2014, which provides a range of functionalities: configuration of price series over user defined time period; comparison of product movements across countries; customisation of price currencies and unit; extraction of price data as excel files to be used offline.
About Malonic Acid
Malonic acid, or propanedioic acid, is a colorless, crystalline solid that has a sour taste. It is a weak acid and can easily break down into salts such as malonates. This substance is renowned for its function as a precursor in the synthesis of numerous organic compounds, such as agrochemicals and medicines. In the food and beverage sector, it is also utilized as an acidity regulator and in the synthesis of specialized polymers and resins.
Malonic Acid Product Details
| Report Features | Details |
| Product Name | Malonic acid |
| Chemical formula | C3H4O4 |
| Industrial Uses | Polymer production, Food and beverage industry, Pharmaceuticals, Cosmetics |
| CAS Number | 141-82-2 |
| Molecular weight | 104.06 g/mol |
| HS Code | 29171920 |
| Synonyms | 1,3-Propanedioic acid |
| Supplier Database | Lonza group, Wuhan Kemi-Works Chemical Co Ltd, Columbus Chemical Industries Inc, TATEYAMA KASEI Co ltd, Hefei TNJ Chemical Industry Co Ltd |
| Region/Countries Covered | Asia Pacific: China, India, Indonesia, Pakistan, Bangladesh, Japan, Philippines, Vietnam, Iran, Thailand, South Korea, Iraq, Saudi Arabia, Malaysia, Nepal, Taiwan, Sri Lanka, UAE, Israel, Hongkong, Singapore, Oman, Kuwait, Qatar, Australia, and New Zealand Europe: Germany, France, United Kingdom, Italy, Spain, Russia, Turkey, Netherlands, Poland, Sweden, Belgium, Austria, Ireland Switzerland, Norway, Denmark, Romania, Finland, Czech Republic, Portugal and Greece North America: United States and Canada Latin America: Brazil, Mexico, Argentina, Columbia, Chile, Ecuador, and Peru Africa: South Africa, Nigeria, Egypt, Algeria, Morocco |
| Currency | US$ (Data can also be provided in local currency) |
| Supplier Database Availability | Yes |
| Customization Scope | The report can be customized as per the requirements of the customer |
| Post-Sale Analyst Support | 360-degree analyst support after report delivery |
Note: Our supplier search experts can assist your procurement teams in compiling and validating a list of suppliers indicating they have products, services, and capabilities that meet your company's needs.
Malonic Acid Production Processes
In the first step of this process, chloroacetic acid is added to an aqueous solution, and then the solution is heated to approximately 50°C. The solution is then chilled and neutralized using sodium carbonate salt. In the next step, sodium cyanide is added to the mixture, and it is again heated to approximately 55 degrees Celsius. Then, with the addition of sodium hydroxide, ammonia is eliminated from the reaction mixture. The solution is mixed with calcium chloride to precipitate calcium malonate, which is then dried, washed, and treated with ether and hydrochloric acid to generate malonic acid as the end product.
Methodology
The displayed pricing data is derived through weighted average purchase price, including contract and spot transactions at the specified locations unless otherwise stated. The information provided comes from the compilation and processing of commercial data officially reported for each nation (i.e. government agencies, external trade bodies, and industry publications).
Assistance from Experts
Procurement Resource is a one-stop solution for businesses aiming at the best industry insights and market evaluation in the arena of procurement. Our team of market leaders covers all the facets of procurement strategies with its holistic industry reports, extensive production cost and pre-feasibility insights, and price trends dynamics impacting the cost trajectories of the plethora of products encompassing various industries. With the best analysis of the market trends and comprehensive consulting in light of the best strategic footstep, Procurement Resource got all that it takes.
Client's Satisfaction
Procurement Resource has made a mark for itself in terms of its rigorous assistance to its clientele. Our experienced panel of experts leave no stone unturned in ensuring the expertise at every step of our clients' strategic procurement journey. Our prompt assistance, prudential analysis, and pragmatic tactics considering the best procurement move for industries are all that sets us apart. We at Procurement Resource value our clients, which our clients vouch for.
Assured Quality
Expertise, judiciousness, and expedience are the crucial aspects of our modus operandi at Procurement Resource. Quality is non-negotiable, and we don't compromise on that. Our best-in-class solutions, elaborative consulting substantiated by exhaustive evaluation, and fool-proof reports have led us to come this far, making us the ‘numero uno' in the domain of procurement. Be it exclusive qualitative research or assiduous quantitative research methodologies, our high quality of work is what our clients swear by.
Table Of Contents
Our Clients

Get in Touch With Us

UNITED STATES
Phone:+1 307 363 1045

INDIA
Phone: +91 8850629517

UNITED KINGDOM
Phone: +44 7537 171117
Email: sales@procurementresource.com

