

Udeesha Tomar
AVP - Strategy and Solutions
Leading procurement research solutions across chemicals, materials, and food & beverages, with expertise in price forecasting and market analytics.

| Product | Region | Incoterm Basis | Price | Last Updated Month |
|---|---|---|---|---|
| MCA (Monochloroacetic Acid) | China | FOB | USD 428.62/MT | July 2026 |
| MCA (Monochloroacetic Acid) | USA | FOB | USD 1,018.45/MT | July 2026 |
| MCA (Monochloroacetic Acid) | Germany | FOB | USD 1,275.12/MT | July 2026 |
| MCA (Monochloroacetic Acid) | Australia | CIF | USD 527.07/MT | July 2026 |
| MCA (Monochloroacetic Acid) | Canada | CIF | USD 1,033.45/MT | July 2026 |
| MCA (Monochloroacetic Acid) | China | FOB | USD 570.00/MT | June 2026 |
| MCA (Monochloroacetic Acid) | USA | FOB | USD 1,060.00/MT | June 2026 |
| MCA (Monochloroacetic Acid) | Germany | FOB | USD 1,380.00/MT | June 2026 |
| MCA (Monochloroacetic Acid) | Australia | CIF | USD 636.00/MT | June 2026 |
| MCA (Monochloroacetic Acid) | Canada | CIF | USD 1,060.00/MT | June 2026 |
Stay updated with the latest MCA (Monochloroacetic Acid) prices, historical data, and tailored regional analysis
Asia
China remained the key Asian market, with MCA (Monochloroacetic Acid) averaging USD 570/MT (FOB) in June. During Q2’26, prices strengthened during April before correcting through May and June as acetic acid costs declined, production recovered and agrochemical buyers reduced purchasing urgency. China’s pesticide technical-material market weakened in June, indicating lower demand for MCA-based herbicide intermediates. Rising operating rates also increased availability and inventories, reinforcing downward pressure. India received additional cost relief after customs duties on imported acetic acid were reduced to zero during Q2, lowering the raw-material burden for MCA producers and importers.
Europe
Germany recorded an average MCA price of USD 1380/MT (FOB) in June. European pricing remained firmer than Asia because chemical producers faced elevated energy, logistics and replacement costs amid geopolitical disruptions. However, demand remained constrained, while competitive imports continued to pressure regional producers. European chemical trade also weakened during Q2, with chemical exports and imports both declining in April, indicating softer cross-border activity. By June, European chemical producer prices were still edging higher, but momentum had moderated as geopolitical risk was increasingly incorporated into market expectations.
North America
The USA recorded an average MCA price of USD 1060/MT (FOB) in June. North American pricing remained supported by comparatively higher production and logistics costs, while downstream chemical demand provided limited upside. Import availability and cautious purchasing prevented stronger price escalation. Broader chemical-market conditions remained sensitive to freight disruptions and feedstock movements, keeping replacement costs elevated even as demand growth moderated.
Analyst Insight
According to Procurement Resource, MCA prices are likely to remain mixed, with weaker agrochemical procurement limiting upside while feedstock, freight and regional supply disruptions provide intermittent support.
Need Latest MCA (Monochloroacetic Acid) Prices?
Get real-time price assessments, periodic trends, forecasts and price driver insights across key global markets.
Our Clients


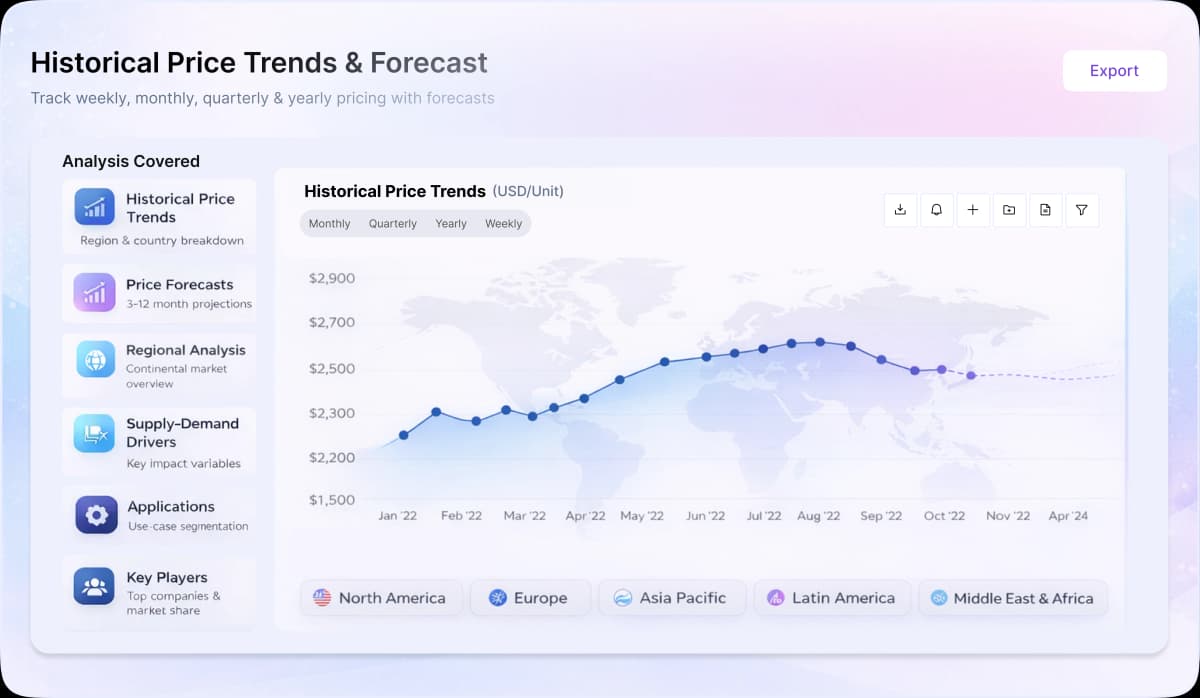
Turn price intelligence into action with the Procurement Resource Database. Log in or subscribe to unlock live price trends, historical charts, supplier databases, cost curves, and analyst-backed insights across chemicals, agriculture, energy, packaging, and more. Use these tools to benchmark your contracts, plan budgets with confidence, and stay ahead of market moves on every product you buy.
0
+Products
0
+Regions
0
+Subscriptions
Asia
In Asia, MCA prices moved upward during Q1’26 amid tightening supply and improving downstream sentiment. In China, the upstream market recorded an approximately 13% quarter-on-quarter increase, while prices rose around 5% between February and March. Plant maintenance activity and constrained operating rates reduced spot availability early in the quarter, while declining inventories and stronger downstream sentiment supported the rebound in March. Rising acetic acid costs, reduced import arrivals, and geopolitical disruptions further strengthened upstream cost pressure. Demand from acetic anhydride and cellulose derivative sectors improved toward the quarter’s end, supporting firmer market fundamentals. In India, MCA prices increased by nearly 10% from February to March due to higher import dependency, elevated freight expenses, and delayed cargo arrivals linked to Strait of Hormuz disruptions and Middle East trade congestion.
Europe
In Europe, MCA prices followed a firm upward trajectory driven by elevated upstream and energy-related costs. Rising crude oil and natural gas volatility increased manufacturing expenses across the regional chemical chain, while logistics disruptions around the Strait of Hormuz sharply increased freight costs and tightened import flows. However, weak industrial activity and cautious procurement from agrochemical and specialty chemical sectors limited the pace of increases despite continued supply-side pressure.
North America
In North America, the MCA market remained firm as higher feedstock and transportation costs supported price momentum throughout the quarter. Elevated freight expenses and tightening global supply conditions increased operational pressure for suppliers, while moderate demand from pharmaceutical, personal care, and industrial applications maintained stable market activity. Buyers largely focused on inventory control and short term purchasing strategies amid persistent volatility.
Analyst Insight
According to Procurement Resource, MCA (Monochloroacetic Acid) is expected to remain firm as constrained supply, elevated logistics costs, and volatile feedstock conditions continue supporting MCA pricing despite cautious downstream demand.
MCA is a chlorocarboxylic acid and a haloacetic acid. It is extracted from acetic acid. It is a conjugate acid of a chloroacetate. In appearance, it a colourless to light-brown crystalline material. It is miscible in water and sinks in it. It is combustible in nature. It is one of the most important halogenated derivatives of acetic acid.
C2H3ClO2
Carboxymethyl Cellulose Or CMC, Pharmaceuticals, Agrochemicals, Dyes, Cosmetics
Chloroacetic Acid, 79-11-8, 2-Chloroacetic Acid
Acros Organics, Nouryon, CABB Group GmbH
CurrencyUS$ (Data can also be provided in local currency)
Supplier Database AvailabilityYes
Customization ScopeThe report can be customized as per the requirements of the customer
Post-Sale Analyst Support360-degree analyst support after report delivery
Note: Our supplier search experts can assist your procurement teams in compiling and validating a list of suppliers indicating they have products, services, and capabilities that meet your company's needs.
In this process, acetic acid is chlorinated with acetic anhydride as a catalyst, which results in the formation of Monochloroacetic Acid with dichloroacetic acid and trichloroacetic acid as impurities. This product is further separated and refined to obtain the desired product.
Our Price Analysis Methodology
AVP - Strategy and Solutions
Leading procurement research solutions across chemicals, materials, and food & beverages, with expertise in price forecasting and market analytics.

Experience how Procurement Resource transforms raw material price data into clear, decision ready intelligence. Optimise your performance with reliable, expert market data and analysis. Schedule your demo today to experience a live walk-through where our experts will showcase interactive price charts, forecasted prices, and insights driving the prices for your key commodities, tailored to your workflows. Contact us now!
Our Team will be happy to assist you
We are just a text away
Still Need Help?
Europe & Africa
+44 7573 171117
Sales@procurementresource.com
USA & Canada
+1 307 363 1045
Sales@procurementresource.com
APAC
+91 8850629517
Sales@procurementresource.com
Unlock full access to Procurement Resource's price databases, interactive charts, and short-term forecasts for thousands of commodities. Elevate your sourcing decisions by comparing prices across regions, downloading historical data, and layering in analyst-backed insights, all with our flexible plans that scale as your portfolio grows.
Still have any Questions
Contact Us



Price Trend Dashboard - What's Included
Price trends across a diverse portfolio of categories and products, spanning board to niche chemicals
Coverage extendable to grade-specific chemicals based on procurement requirements
Regular price tracking supported by robust historical datasets
News, policy updates, and key market drivers impacting price movements
Short-term and long-term price outlooks and forecasts
Supply–demand dynamics and capacity-driven market analysis

Track prices, market movements, supply-demand dynamics, and industry developments across hundreds of commodities through a centralized intelligence platform built for informed procurement decisions.

Understand market fluctuations using analyst-backed forecasts, historical pricing patterns, and evolving industry trends to strengthen sourcing strategies and budget planning.

Leverage cost models, pricing benchmarks, and procurement insights to evaluate purchasing opportunities, improve negotiations, and enhance operational efficiency.
Access region-specific price trends, trade activities, capacity changes, and supply chain developments influencing commodity markets worldwide.