Melamine Price Trend Analysis 2026: Historical Prices, Supply Demand Analysis, Market Insights, Latest News & Price Drivers

Shriya Singh profile photo
Written ByShriya Singh

Procurement Resource Database

Laptop screen

Turn price intelligence into action with the Procurement Resource Database. Log in or subscribe to unlock live price trends, historical charts, supplier databases, cost curves, and analyst-backed insights across chemicals, agriculture, energy, packaging, and more. Use these tools to benchmark your contracts, plan budgets with confidence, and stay ahead of market moves on every product you buy.

0

+

Products

0

+

Regions

0

+

Subscriptions

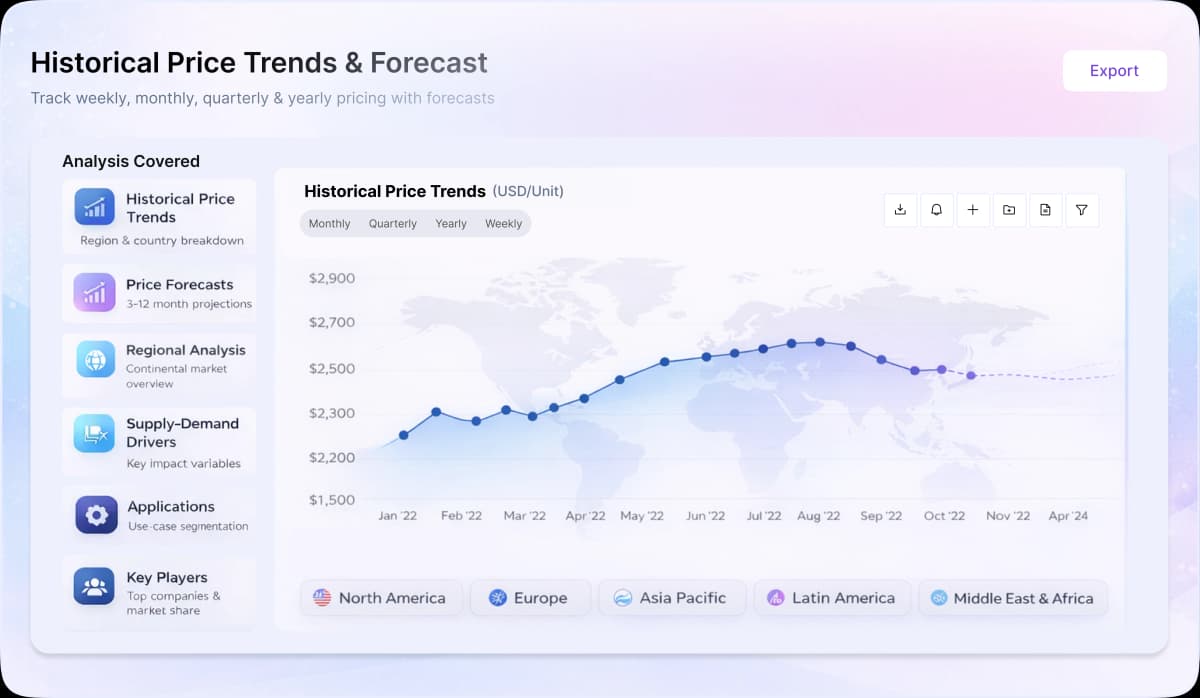
  • Global melamine prices showed a sharp upward trend in Q1 2026, shifting from weak stability in January to a strong surge in March, driven by cost shocks and supply tightening.
  • Feedstock pressure intensified as urea prices strengthened, further amplified by the Iran war and disruptions in the Strait of Hormuz, which severely impacted global fertilizer trade and raised production costs.
  • Downstream demand improved gradually after the Spring Festival, with restocking in panel and coatings sectors supporting price transmission despite earlier weakness.

Asia

In China, the melamine price curve witnessed a fluctuating trajectory with an upward bias in the first quarter of 2026. The quarter began with weak demand and oversupply pressure, keeping prices soft despite slight cost support. Ahead of the Chinese New Year and Spring Festival, prices saw limited upward movement due to tight supply and firm urea costs. Post-holiday, demand recovery was slow, and prices remained largely stable due to balanced supply-demand conditions.

Entering March, the market surged sharply as the Iran war and disruptions in the Strait of Hormuz severely impacted global urea trade, tightening supply and sharply increasing costs. Around 35% of global seaborne urea trade was disrupted, while Iran’s exports declined significantly, triggering strong cost transmission across the melamine chain. Tight domestic supply, plant maintenance, and strong downstream restocking further accelerated price increases.

Europe

In Europe, melamine prices followed an upward trend, supported by rising import costs and tight global supply. The Iran war and Strait of Hormuz disruptions increased energy and fertilizer costs, directly impacting urea-linked production economics and supporting prices despite moderate demand.

North America

In North America, melamine prices also strengthened, driven by higher feedstock costs and global supply disruptions. Logistics risks and rising energy costs linked to Middle East tensions increased production expenses, while steady demand from construction and coatings sectors supported the market.

About Melamine

Melamine, also known as cyanuramide, is a colourless crystalline compound. It is a nitrogen-rich compound whose derivatives are used as flame retardants. It is used to make thermosetting plastics, plywood, kitchenware, dinnerware and melamine resins.

Melamine Product Detail

Hs Code
29336100
Chemical Formula

C3H6N6

Cas Number
108-78-1
Molecular Weight
126.119 g/mol
Industrial Uses

Thermosetting Plastics, Plywoods, melamine resins, soundproof materials

Synonyms

Cyanuramide, Triamino Triazine

Supplier Database

Sichuan Golden Elephant Chemical, Nissan Chemical Industries, BASF SE, Mitsui Chemicals Inc., OCI Nitrogen, Cornerstone Chemical Company, Borealis AG, Haohua Junhua Group Co. Ltd., Methanol Holdings.

Regional Coverage

Asia Pacific

China, India, Indonesia, Pakistan, Bangladesh, Japan, Philippines, Vietnam, Iran, Thailand, South Korea, Iraq, Saudi Arabia, Malaysia, Nepal, Taiwan, Sri Lanka, UAE, Israel, Hongkong, Singapore, Oman, Kuwait, Qatar, Australia, and New Zealand

Europe

Germany, France, United Kingdom, Italy,Spain, Russia, Turkey, Netherlands, Poland, Sweden, Belgium, Austria, Ireland Switzerland, Norway, Denmark, Romania, Finland, Czech Republic, Portugal and Greece

North America

United States and Canada

Latin America

Brazil, Mexico, Argentina, Columbia, Chile, Ecuador, and Peru

Africa

South Africa, Nigeria, Egypt, Algeria, Morocco

CurrencyUS$ (Data can also be provided in local currency)

Supplier Database AvailabilityYes

Customization ScopeThe report can be customized as per the requirements of the customer

Post-Sale Analyst Support360-degree analyst support after report delivery

Note: Our supplier search experts can assist your procurement teams in compiling and validating a list of suppliers indicating they have products, services, and capabilities that meet your company's needs.

Melamine Production Processes

Melamine is produced by using urea as the starting material. Urea is decomposed into cyanic acid and ammonia, and cyanic acid further polymerizes to form melamine.

Frequently Asked Questions

Melamine prices showed a sharp upward trend during Q1 2026. In China, prices increased by 27.22% from January to March, while India recorded a 22.33% increase. The quarter began with weak stability, but prices surged in March as urea costs rose sharply and supply tightened.
The melamine outlook for 2026 is expected to remain sensitive to urea feedstock costs, plant operating rates, and demand from laminates, wood panels, coatings, adhesives, and molding compounds. Demand may improve with construction and furniture activity, but new capacity and weak downstream buying could limit strong price gains in some regions.
Melamine prices are primarily influenced by urea feedstock costs, plant operating rates, and supply-demand conditions across the laminates, wood panels, coatings, adhesives, and molding compounds sectors. Changes in urea availability, production outages, downstream restocking activity, export demand, and inventory levels can significantly affect market sentiment and pricing trends. In addition, energy costs and environmental regulations may influence production economics and supply availability.
China is the dominant producer and consumer of melamine due to its large urea-based production capacity and strong downstream resin industry. Other important market participants include Germany, the Netherlands, Qatar, the United States, India, and Japan. Major producers include OCI, Borealis, Prefere Melamines, Cornerstone Chemical, Qatar Melamine Company, Sichuan Golden Elephant, and Henan Xinlianxin.
In January 2026, Proman Trinidad temporarily suspended production at its melamine plant in Point Lisas for an initial two-year period, citing continued unfavorable global market conditions. The shutdown reduced regional supply availability and reflected persistent pressure from weak margins, elevated production costs, and competitive global market conditions.
Melamine is produced from urea, so urea price movement directly affects production economics. In Q1 2026, higher urea prices raised melamine manufacturing costs, especially for producers exposed to volatile fertilizer and natural gas markets. When producers face higher urea costs, they usually increase melamine offers to protect margins.
Plant operating rates strongly influence melamine supply because production is concentrated among integrated urea and chemical producers. Lower operating rates, maintenance shutdowns, or prolonged plant closures reduce market availability and support prices when downstream demand is steady. Higher operating rates can ease supply tightness but may pressure prices if buyer demand is weak.
Procurement Resource employs a structured methodology combining primary research, secondary market data, analytical models, and validation processes to assess melamine prices and trends. Price evaluations incorporate supply-demand dynamics, feedstock movements, trade flows, and value chain analysis, supported by continuous market monitoring to ensure accurate and reliable insights.

About the Author

Shriya Singh profile photo

Shriya Singh

Business Insights Analyst

Helping procurement and sourcing teams navigate complex markets through data-driven research, category intelligence, and actionable insights - with a focus on identifying market trends, analyzing supply-side developments, and delivering clear intelligence that supports informed business decisions.

Our Price Analysis Methodology

Schedule Demo

Schedule a demo

Experience how Procurement Resource transforms raw material price data into clear, decision ready intelligence. Optimise your performance with reliable, expert market data and analysis. Schedule your demo today to experience a live walk-through where our experts will showcase interactive price charts, forecasted prices, and insights driving the prices for your key commodities, tailored to your workflows. Contact us now!

Our Team will be happy to assist you

We are just a text away

+1

Still Need Help?

Europe & Africa

+44 7573 171117

[email protected]

USA & Canada

+1 307 363 1045

[email protected]

APAC

+91 8850629517

[email protected]

Unlock full access to Procurement Resource's price databases, interactive charts, and short-term forecasts for thousands of commodities. Elevate your sourcing decisions by comparing prices across regions, downloading historical data, and layering in analyst-backed insights, all with our flexible plans that scale as your portfolio grows.

Still have any Questions

Contact Us
Mastercard
Wire
VISA
Stripe

Why Procurement Database

Commodity Market Intelligence

Commodity Market Intelligence

Track prices, market movements, supply-demand dynamics, and industry developments across hundreds of commodities through a centralized intelligence platform built for informed procurement decisions.

Price Forecasts & Market Outlooks

Price Forecasts & Market Outlooks

Understand market fluctuations using analyst-backed forecasts, historical pricing patterns, and evolving industry trends to strengthen sourcing strategies and budget planning.

Cost & Procurement Optimization

Cost & Procurement Optimization

Leverage cost models, pricing benchmarks, and procurement insights to evaluate purchasing opportunities, improve negotiations, and enhance operational efficiency.

Global & Regional Market Insights

Global & Regional Market Insights

Access region-specific price trends, trade activities, capacity changes, and supply chain developments influencing commodity markets worldwide.

1/4