Product
Monoammonium Phosphate (MAP) Price Trend and Forecast
Monoammonium Phosphate (MAP) Price Trend and Forecast
Monoammonium Phosphate (MAP) Regional Price Overview
Get the latest insights on price movement and trend analysis of Monoammonium Phosphate (MAP) in different regions across the world (Asia, Europe, North America, Latin America, and the Middle East & Africa).
Monoammonium Phosphate Price Trend for the Second Half of 2023
Asia
In Asian countries, monoammonium phosphate prices experienced an upward trend during the discussed period, driven by demand from the agriculture sector, where monoammonium phosphate serves as a commonly used phosphorus fertilizer. Factors like feedstock ammonia and phosphoric acid availability also contributed to the price increase.
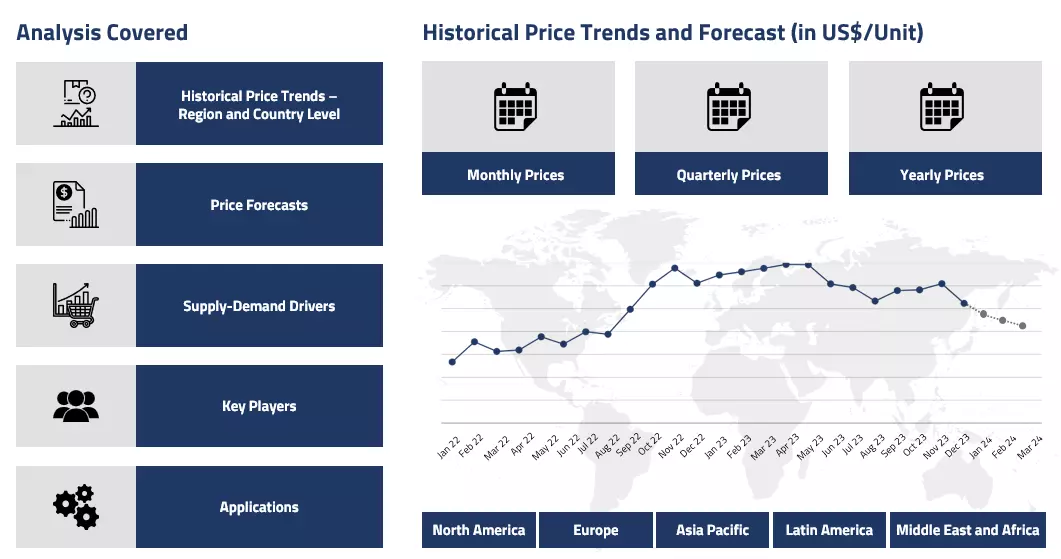
Monoammonium Phosphate Price Chart

Please Login or Subscribe to Access the Monoammonium Phosphate Price Chart Data
In China, monoammonium phosphate prices saw a notable rise over the three-month period in the last quarter of the year, reflecting positive market dynamics of the downstream industries and expansion of consumer budget in view of ease in inflationary pressure. Similarly, in India, concerns were raised over rising monoammonium phosphate prices, prompting discussions about potential fertilizer subsidy adjustments.
Europe
In Europe, the monoammonium phosphate market also witnessed price growth during the specified period. Also, western sanctions on Russia and the conclusion of the black sea deal heightened challenges for the European fertilizer industry. Despite supply constraints, increasing demand supported upward price movements for monoammonium phosphate. The uptick in the market was also supported by the enhancement in the number of bulk purchases and escalating cost of energy, which raised the cost of production and, in turn, the price graph of monoammonium phosphate.
North America
In North America, the DAP market followed a similar trajectory to its global counterparts, with prices showing an upward trend. Disruptions in supply chains due to conflicts involving Russia and Israel, coupled with rising market demands, contributed to the overall positive price trend observed during the period. In support of this, the rising cost of feedstock materials and only limited inventory levels further pushed the monoammonium phosphate prices in an upward trajectory.
Analyst Insight
According to Procurement Resource, the price trend of Monoammonium Phosphate is expected to incline as the delay in the winter sowing season will positively impact the price trajectory of monoammonium phosphate prices.
Monoammonium Phosphate Price Trend for the First Half of 2023
Asia
Monoammonium phosphate, an essential component of water-soluble fertilizers, encountered difficulties in the first two quarters of 2023 in the Asian market. Monoammonium phosphate inventories rose significantly, and weak support from downstream sectors hampered the growth.
Feedstock costs also failed to support the prices during this phase. As bulk purchases dramatically declined in the second quarter, the price trend for monoammonium phosphate continued to decline. Reduced export volumes, economic circumstances that resembled a recession, and a lack of precipitation all had an effect on the market and caused monoammonium phosphate prices to plummet.
Europe
The price trend of monoammonium phosphate declined in Europe during the first two quarters of 2023 due to a number of variables. These included the low price of natural gas, the effects of the US banking crisis, and regular price reductions by traders as a result of the first quarter's slow offtake from downstream sectors.
Prices continued to decline in the second quarter, helped by the lingering Russia-Ukraine crisis and a slowdown in the global economy. Additionally, significant rain and unfavorable weather had a detrimental impact on agriculture, which decreased the cost of monoammonium phosphate.
North America
In North America, the demand for monoammonium phosphate experienced a significant decline in both domestic and international industries during the first half of 2023. Consumers hesitated to place bulk orders due to concerns about an impending recession and rising inflation rates in the North American market.
The region's economy underwent a significant fall following the failure of two major banks, resulting in reduced manufacturing activities and decreased consumer spending appetite. Thus, these economic factors contributed to the downward movement of monoammonium phosphate prices.
Analyst Insight
According to Procurement Resource, the price trend of Monoammonium Phosphate will follow a southwards trajectory as the demand from the agriculture and other downstream sectors does not seem to support the rise in monoammonium phosphate price trend.
Monoammonium Phosphate Price Trend For the Second, Third and Fourth Quarters of 2022
Asia
The demand for water-soluble fertilizers increased abruptly in the second and third quarters of 2022, and thus the prices of monoammonium phosphate inclined. The domestic Asia-Pacific demand for fertilizers was positively influenced by the consistent number of purchases and insufficient working of the supply chains that also supported the surge in the prices of monoammonium phosphate.
The trend took a bearish turn in the fourth quarter as the demand declined, and due to a rise in production activities, the stockpiles inclined, forcing the producers to lower their price quotations.
Europe
The second quarter of 2022 struggled to maintain the prices of monoammonium phosphate as the cost of crude oil and natural gas increased by several folds, but the market was stable as the demand of downstream industries supported the market sentiments. However, similar to the trend observed in the Asia-Pacific region, the price trend of monoammonium phosphate inclined in the third quarter and then declined in the fourth.
The third quarter prices were supported by the rise in procurement rates of the domestic agriculture department. In the fourth quarter, the supply rose significantly, but the end-user demand fell gradually. In addition to this, the coal and natural gas costs also remained volatile, which led to the downfall of monoammonium phosphate prices.
North America
The increase in the production of urea and potash stabilized the monoammonium phosphate price trend amid the rising cost of production due to the volatility in the fuel market. Further, the downstream fertilizers sector increased its number of inquiries of monoammonium phosphate, which also helped its demand to grow in the third quarter of 2022.
But in the fourth quarter, it was adversely affected by the falling cost of ammonia and end-user products. The overall market dynamics of monoammonium phosphate remained uncertain throughout this quarter and thus pushed its price trend into a negative zone.
Analyst Insight
According to Procurement Resource, the price trend of Monoammonium phosphate is estimated to fall as the market sentiments of the fertilizers sector are expected to remain weak.
Monoammonium Phosphate Price Trend For the First Quarter of 2022
Europe
As a consequence of the Russia-Ukraine war, the energy and fertilizer prices increased. Russia is major exporter of phosphates, responsible for around 4 million tonnes of DAP and MAP exports. The war affected the phosphate supplies which increased MAP prices.
North America
Fertilizer prices have increased by 300% in the last year. Some of the increase can be attributed to supply chain issues. However, the Russia-Ukraine conflict is exacerbating this trend. MAP prices were up 10% in March from the previous month, with an average price of 1,018 USD/MT.
Monoammonium Phosphate Price Trend For the Fourth Quarter of 2021
Asia
China had decided to ban phosphate exports to keep down the domestic prices. Australia is mainly dependent on China with a monthly average of 65% of MAP imports. The fertilizer costs increased in the region amid rising prices of natural gas and coal along with supply shortages.
Europe
In Europe, the fertilizer production was halted in December 2021, as many manufacturing facilities could not keep up with the rising energy prices. This contributed to the global fertilizer shortage and increased the price of fertilizers. DAP prices had almost doubled in Europe in a period of 18 months. Sanctions on imports from Belarus were also a factor in the rise of price in the region.
North America
DAP witnessed a growth of price from 421 USD/MT in the beginning of the year to 745 USD, rising by 76% to a 13 year high. Morocco phosphate rock prices climbed from 83.33 USD/MT to 176.67 USD/MT, rising by 112% on a year-to-year basis.
Latin America
In December, the MAP prices in Brazil had climbed to 858 USD/MT (up by almost 450 USD/MT) backed by global shortages. Even though the market was going through an off-season purchasing period, the prices were at record high levels in Brazil in Q4 2021.
Monoammonium Phosphate Price Trend For First, Second and Third Quarters of 2021
Asia
Suez Canal was blocked in the beginning of the year which caused logistic issues and increased the freight costs. However, the costs came down after China decided to suspend exports which strongly affected the phosphate prices as China is responsible for 30% of the global supply with 90 MMT of annual production. Exports were halted to build domestic stores of the chemical to ensure food supply in future.
Exports from China were drastically reduced in 2021. Australia was impacted by the global shortage of monoammonium and diammonium phosphate grades- MAP and DAP, causing prices to rise in in the region to about 675 USD/MT excluding freight costs. MAP prices increased after the prices of upstream ammonia increased as a result of soaring prices of natural gas.
Europe
The natural gas shortage in Europe drove up the prices in the downstream fertilizer industries with an increase in the prices of ammonia, a key raw material in the production of MAP. Europe is mostly dependent on imports, but major phosphate producing countries like China and Russia reduced their exports, leading to a price increase in the region.
North America
In the first quarter of 2021, US authorities imposed 20% import duties on Moroccan phosphates and about 10-47% import duties on the Russian ones. This brought down the exports from Morocco and Russia. By the end of the second quarter, DAP prices in the US were around 604.75 USD as costs for farming input, energy and freight transport costs increased.
In the third quarter, the phosphate sector had been affected by the challenges posed by the Hurricane Ida as a major American producer Mosaic reported a negative impact on production and operations. As a result of the hurricane, production was cut down by 300,000 tonnes. In August, MAP prices increased to 755 USD/MT. As compared to September 2020, the price had risen by 125%.
Latin America
The phosphate import in Brazil in the first three quarters of 2021 was 7.8 MMT, up by 1.7 MMT on a year-on-year basis. The demand was high, but the production was low which drove up the import volumes in the country.
Monoammonium Phosphate Price Trend For the Year 2020
Asia
China, a major producer, consumer and exporter of phosphate had been heavily affected by the pandemic in the first quarter of 2020, which impacted the phosphate industry as prices witnessed decade-long lows in the beginning of the year.
Most plants started to close in Hubei, a major phosphate producing region in the country. As lockdowns and restrictions affected the supplies, the price began to rise in April 2020. Other problems like delay in shipments and disruptions in transportations were also major contributors to the price rise.
Logistic issues were also faced in India, a major producer and importer of the chemical, as most migrant workers returned home due to the lockdowns causing supply chain disruptions. The demand kept rising amid tight supplies which aggravated MAP prices in the region. The Hubei province in China is responsible for about 30% of the phosphate production.
However, the Chinese market rebounded in the second half of the year, as production activities resumed in the region. The production mainly focused at the domestic market and price for phosphate exports were increased steadily. The demand and price for corn, soybean and other phosphate-intensive crops increased which also boosted the its market in the region.
Europe
Countries like Russia faced shortages in phosphate supplies, as a result of supply chain disruptions from major exporting countries like Europe and India. Russia was the fourth largest phosphate producer in the world in 2020 with a tally of 13 MMT.
North America
The price of phosphate rock climbed to 83.33 USD by the end of 2020. The price had begun to rise in the second half of the year after the economies started to recover from the loss in the beginning of the year due to the pandemic. Supplies were tight and the demand was high which benefitted the fertilizer industry. The DAP price in US had reached 388.50 USD/MT in December, rising from 245 USD/MT in the beginning of the year.
Procurement Resource provides latest prices of Monoammonium Phosphate (MAP). Each price database is tied to a user-friendly graphing tool dating back to 2014, which provides a range of functionalities: configuration of price series over user defined time period; comparison of product movements across countries; customisation of price currencies and unit; extraction of price data as excel files to be used offline.
About Monoammonium Phosphate (MAP)
Monoammonium Phosphate is dissolvable in water. It crystallises from water as the anhydrous salt in the tetragonal system, as elongated prisms or needles. However, it is practically insoluble in ethanol. Solid form of Mono Ammonium Phosphate is considered stable in practice for temperatures up to 200 °C.
Monoammonium Phosphate (MAP) Product Details
| Report Features | Details |
| Product Name | Monoammonium Phosphate (MAP) |
| Industrial Uses | Agricultural chemicals (non-pesticidal), Flame retardants, Processing aids, Used in wastewater treatment plant, Agricultural products (non-pesticidal), Building/construction materials, Wood and Engineered wood products, Cleaning and furnishing care products, Electrical and electronic products, Fire suppression chemical, Lawn and Garden care products, Paper Products |
| Chemical Formula | H6NO4P |
| Synonyms | Ammonium dihydrogen phosphate, 7722-76-1, Ammonium biphosphate, Phosphoric acid, monoammonium salt |
| Molecular Weight | 115.03 g/mol |
| Supplier Database | Eurochem Group , Agrium Inc., Yara International ASA, CF Industries Holdings Inc., Coromandel International Ltd., The Mosaic Co, Shifang Changfeng Chemical Co. Ltd |
| Region/Countries Covered | Asia Pacific: China, India, Indonesia, Pakistan, Bangladesh, Japan, Philippines, Vietnam, Iran, Thailand, South Korea, Iraq, Saudi Arabia, Malaysia, Nepal, Taiwan, Sri Lanka, UAE, Israel, Hongkong, Singapore, Oman, Kuwait, Qatar, Australia, and New Zealand Europe: Germany, France, United Kingdom, Italy, Spain, Russia, Turkey, Netherlands, Poland, Sweden, Belgium, Austria, Ireland Switzerland, Norway, Denmark, Romania, Finland, Czech Republic, Portugal and Greece North America: United States and Canada Latin America: Brazil, Mexico, Argentina, Columbia, Chile, Ecuador, and Peru Africa: South Africa, Nigeria, Egypt, Algeria, Morocco |
| Currency | US$ (Data can also be provided in local currency) |
| Supplier Database Availability | Yes |
| Customization Scope | The report can be customized as per the requirements of the customer |
| Post-Sale Analyst Support | 360-degree analyst support after report delivery |
Note: Our supplier search experts can assist your procurement teams in compiling and validating a list of suppliers indicating they have products, services, and capabilities that meet your company's needs.
Monoammonium Phosphate (MAP) Production Processes
- Monoammonium Phosphate (MAP) Production from Ammonia and Phosphoric Acid
Monoammonium Phosphate is prepared by a reaction of anhydrous ammonia and phosphoric acid in batch or continuous reactors. Since the partial pressure of ammonia over this acidic solution is relatively low, it is further crystallised in traditional crystallisers.
Methodology
The displayed pricing data is derived through weighted average purchase price, including contract and spot transactions at the specified locations unless otherwise stated. The information provided comes from the compilation and processing of commercial data officially reported for each nation (i.e. government agencies, external trade bodies, and industry publications).
Assistance from Experts
Procurement Resource is a one-stop solution for businesses aiming at the best industry insights and market evaluation in the arena of procurement. Our team of market leaders covers all the facets of procurement strategies with its holistic industry reports, extensive production cost and pre-feasibility insights, and price trends dynamics impacting the cost trajectories of the plethora of products encompassing various industries. With the best analysis of the market trends and comprehensive consulting in light of the best strategic footstep, Procurement Resource got all that it takes.
Client's Satisfaction
Procurement Resource has made a mark for itself in terms of its rigorous assistance to its clientele. Our experienced panel of experts leave no stone unturned in ensuring the expertise at every step of our clients' strategic procurement journey. Our prompt assistance, prudential analysis, and pragmatic tactics considering the best procurement move for industries are all that sets us apart. We at Procurement Resource value our clients, which our clients vouch for.
Assured Quality
Expertise, judiciousness, and expedience are the crucial aspects of our modus operandi at Procurement Resource. Quality is non-negotiable, and we don't compromise on that. Our best-in-class solutions, elaborative consulting substantiated by exhaustive evaluation, and fool-proof reports have led us to come this far, making us the ‘numero uno' in the domain of procurement. Be it exclusive qualitative research or assiduous quantitative research methodologies, our high quality of work is what our clients swear by.
Table Of Contents
Our Clients

Get in Touch With Us

UNITED STATES
Phone:+1 307 363 1045

INDIA
Phone: +91 8850629517

UNITED KINGDOM
Phone: +44 7537 171117
Email: sales@procurementresource.com

