Need latest Natural Gas prices?
Get real-time price assessments, periodic trends, forecasts and price driver insights across key global markets.
Unlock Price Insights NowOur Clients
| Product | Region | Incoterm Basis | Price | Last Updated Month |
| Natural Gas | USA | FOB | USD 2.77/Mbtu | April 2026 |
| Natural Gas | Saudi Arabia | FOB | USD 750.00/MT | April 2026 |
| Natural Gas | Netherlands | FOB | USD 45.99/MMBtu | April 2026 |
| Natural Gas | Japan | FOB | USD 17.08/MMBtu | April 2026 |
| Natural Gas | India | FOB | USD 10.76/Mbtu | April 2026 |
| Natural Gas | USA | FOB | USD 3.04/Mbtu | March 2026 |
| Natural Gas | Saudi Arabia | FOB | USD 545.00/MT | March 2026 |
| Natural Gas | Netherlands | FOB | USD 50.75/MMBtu | March 2026 |
| Natural Gas | Japan | FOB | USD 937.50/MT | March 2026 |
| Natural Gas | India | FOB | USD 10.77/Mbtu | March 2026 |
Stay updated with the latest Natural Gas prices, historical data, and tailored regional analysis
Asia
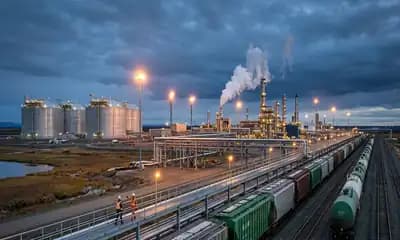
Asian natural gas markets were extremely volatile due to supply disruption caused by the Iran war and blockage of the Strait of Hormuz, which affected the supply of natural gas from Qatar and the UAE, accounting for almost 20% of the world’s total production. About 50% of India’s natural gas requirement is met through imports, out of which approximately 60 million standard cubic meters per day is imported from the Middle East, making India very vulnerable to any kind of disruption. This resulted in prioritizing the supply of natural gas to fertilizers and domestic sectors, limiting the supply to industries. Even though international prices surged, domestic prices fell from INR 15.25/kg (Contract FD) in January to INR 11.88/kg in March, representing a decline of 22.1%.
Europe
In Europe, natural gas prices witnessed upward movement owing to low LNG supplies and competition from Asia. The diversion of the cargoes towards Asia created supply shortages in Europe, with stockpiling being below average for the season. This increased the need to procure more natural gas, which saw the cessation of the supply of LNG from Qatar and the disruption of the passage through the Strait of Hormuz, further intensifying the supply shortage problem. There was a shift in trade flows, with the United States exporting more natural gas to Europe, at about 22.7 million tons in Q1’26. Demand for natural gas from industries and chemicals was subdued.
North America
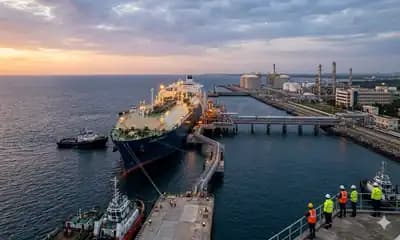
Natural gas markets in North America remained stable, despite the logistical problems experienced in other regions, owing to adequate domestic production and exports. The United States operated at full LNG export capacity, making it impossible for it to increase supply and compensate for the losses incurred worldwide, owing to the war in Iran and the disruption of passages via the Strait of Hormuz. There were increased exports to both Europe and Asia, at an estimated rate of 3.75 million metric tons in Q1’26.
Analyst Insight
According to Procurement Resource, natural gas prices are expected to remain volatile globally due to continued geopolitical risks and supply disruptions.
Related Report
Get real-time price assessments, periodic trends, forecasts and price driver insights across key global markets.
Unlock Price Insights NowOur Clients

Turn price intelligence into action with the Procurement Resource Database. Log in or subscribe to unlock live price trends, historical charts, supplier databases, cost curves, and analyst-backed insights across chemicals, agriculture, energy, packaging, and more. Use these tools to benchmark your contracts, plan budgets with confidence, and stay ahead of market moves on every product you buy.

0
+Products
0
+Regions
0
+Subscriptions
Asia
In Q4’25, the prices of natural gas in Asia were mixed but firm. In the major countries that import this commodity, like India, the prices rose throughout the period. This was because of the strong demand from the power sector and fertilizer industries. These countries were preparing for the peak winter season. LNG imports were stable as the Asian countries secured the necessary supplies to meet the growing demand. However, the global supply of this commodity was impacted by the policy support to the export of this commodity from the US. In some countries of East Asia, the prices were slightly impacted by the mild weather. Nevertheless, the prices were stable to higher compared to the beginning of Q4. The prices in the Indian domestic market settled at around 15 USD/MT (Contract FD) in December’25.
Europe
European natural gas prices were highly volatile in Q4’25. During the initial weeks of the winter season, cold spells were experienced, which resulted in a temporary boost to the prices. However, the occurrence of warm spells towards the end of the season restricted the prices from increasing further. Storage levels were comfortable in the European region, which prevented the prices from increasing. Europe continued to receive high imports of LNG to compensate for the reduction in Russian pipeline supplies. However, the arrival of adequate supplies restricted the prices from increasing. Industrial gas demand was volatile because of the slow economic growth rate. Towards the end of the season, the prices were subdued because of the warm weather forecast.
North America
In the North American region, the prices of natural gas fluctuated considerably, though overall prices weakened towards the end of Q4. Despite the large withdrawal from storage reported by the U.S. Energy Information Administration, prices did not show any uptrend. This was mainly due to the fact that production remained close to record highs, which helped the prices. Though the prices had shown a sharp uptrend in the futures, the forecasts for mild weather conditions towards the end of the month pulled the prices down.
Analyst Insight
According to Procurement Resource, Natural Gas prices are expected to remain highly weather-dependent, with stable supply likely to limit sharp gains unless prolonged cold conditions returned.
Natural Gas, a fossil energy source formed deep beneath the earth's surface, is a mixture of several compounds and/or gases. It is primarily composed of hydrocarbon elements while its largest component is methane. It is a non-renewable hydrocarbon, which is utilised as an energy source for various purposes including cooking, heating, and electricity generation.
It serves as an important chemical feedstock in the production of commercially important organic chemicals and is further used as a fuel for vehicles. Crude form of Natural Gas is often referred to as wet natural gas because, along with methane, it contains NGLs (natural gas liquids), and water vapour.
Fertilizer, Antifreeze, Plastics and glass, Fabrics, Chemical feedstock, Paint, Power generation, Transportation, Animal and fish feed
Gazprom PAO, Royal Dutch Shell Plc, Exxon Mobil Corporation, Total SA, PetroChina Company Limited, BP Plc
CurrencyUS$ (Data can also be provided in local currency)
Supplier Database AvailabilityYes
Customization ScopeThe report can be customized as per the requirements of the customer
Post-Sale Analyst Support360-degree analyst support after report delivery
Note: Our supplier search experts can assist your procurement teams in compiling and validating a list of suppliers indicating they have products, services, and capabilities that meet your company's needs.
In order to produce consumer-grade, or pipeline quality natural gas, the crude natural gas (wet gas) obtained from oil wells is sent to a processing plant to remove water vapour and nonhydrocarbon compounds like sulphur, helium, carbon dioxide, etc. After the removal of these impurities, NGLs are also separated from the wet gas, and the processed Natural Gas is sent through pipelines for distribution after the addition of odorants.
Our Price Analysis Methodology

Experience how Procurement Resource transforms raw material price data into clear, decision ready intelligence. Optimise your performance with reliable, expert market data and analysis. Schedule your demo today to experience a live walk-through where our experts will showcase interactive price charts, forecasted prices, and insights driving the prices for your key commodities, tailored to your workflows. Contact us now!
Our Team will be happy to assist you
We are just a text away
Still Need Help ?
This report gives an economic analysis of syngas production through the steam reforming process. Syngas formation is strongly endothermic, thus, demands high temperatures.
This report presents a detailed cost analysis of azane production from natural gas. In this process, natural gas is used as a feedstock to produce syngas.
This report provides the cost structure of LPG production by natural gas processing. In this method, the crude oil recovered from the oil wells is sent to the gas trap where it is separated into wet gas and oil.
This report provides the cost structure of ammonia production by Haber Process.
Unlock full access to Procurement Resource's price databases, interactive charts, and short-term forecasts for thousands of commodities. Elevate your sourcing decisions by comparing prices across regions, downloading historical data, and layering in analyst-backed insights, all with our flexible plans that scale as your portfolio grows.
Still have any Questions
Contact Us


Price Trend Dashboard - What's Included
Price trends across a diverse portfolio of categories and products, spanning board to niche chemicals
Coverage extendable to grade-specific chemicals based on procurement requirements
Regular price tracking supported by robust historical datasets
News, policy updates, and key market drivers impacting price movements
Short-term and long-term price outlooks and forecasts
Supply–demand dynamics and capacity-driven market analysis