Spanish Producers Seek 20% Supply Withdrawal
Spanish olive oil producers propose temporarily withdrawing up to 20% of production to curb falling prices. The supply cut could help stabilize or lift prices by reducing market volume.

Spanish olive oil producers propose temporarily withdrawing up to 20% of production to curb falling prices. The supply cut could help stabilize or lift prices by reducing market volume.
EU oilseed production falls 1% amid heat and drought, prompting a 7% increase in imports for 2026/27. Lower domestic harvests of rapeseed and sunflower tighten supply, while higher crushing volumes support processing demand, likely pushing oilseed prices upward.
| Product | Region | Incoterm Basis | Price | Last Updated Month |
|---|---|---|---|---|
| Olive Oil | Italy | FOB | USD 3,812.63/MT | August 2026 |
| Olive Oil | USA | FOB | USD 5,876.01/MT | August 2026 |
| Olive Oil | Spain | FOB | USD 3,812.63/MT | August 2026 |
| Olive Oil | Greece | FOB | USD 3,360.67/MT | August 2026 |
| Olive Oil | Tunisia | FOB | USD 3,060.28/MT | August 2026 |
| Olive Oil | Italy | FOB | USD 3,996.64/MT | July 2026 |
| Olive Oil | USA | FOB | USD 6,185.27/MT | July 2026 |
| Olive Oil | Spain | FOB | USD 3,574.14/MT | July 2026 |
| Olive Oil | Greece | FOB | USD 3,197.31/MT | July 2026 |
| Olive Oil | Tunisia | FOB | USD 3,060.28/MT | July 2026 |
Stay updated with the latest Olive Oil prices, historical data, and tailored regional analysis
In Spain, the average price of Olive Oil rose from ~USD 3,574.14/MT (FOB) in July to ~USD 3,812.63/MT in August, an increase of ~6.7%. Italy moved the other way, easing about 4.6% from ~USD 3,996.64/MT (FOB) to ~USD 3,812.63/MT. Spanish origin prices weakened through July into mid-August, as the Agriculture Ministry reported stocks of 569,287 tonnes in July, well above a year earlier, and sales from mills slowed. From late August, prices firmed as heat and drought cut estimates for Spain’s 2026/27 crop to 1.4–1.5 million tonnes, and stocks fell further. Italian values stayed far below last year, as Spain’s production recovery pulled regional prices down. In the USA, prices fell about 5.0%, from ~USD 6,185.27/MT (FOB) to ~USD 5,876.01/MT. North American import costs eased with lower Mediterranean origin prices, and imports into the US and Canada declined while most other markets bought more. Strongly growing Tunisian supply added further competition.
Analyst Insight
According to Procurement Resource, in the near term, olive oil prices may find firmer footing as smaller crop expectations reduce supply, though large existing stocks and slow sales could keep any recovery gradual.
Related Report
Need Latest Olive Oil Prices?
Get real-time price assessments, periodic trends, forecasts and price driver insights across key global markets.
Our Clients


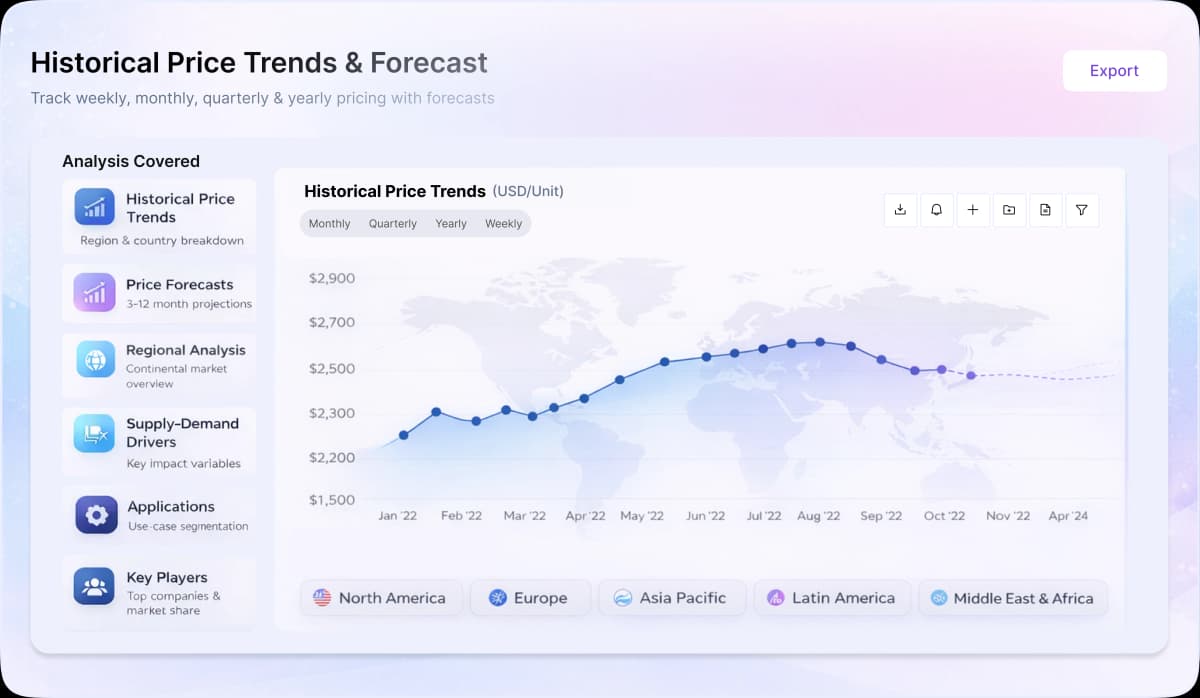
Turn price intelligence into action with the Procurement Resource Database. Log in or subscribe to unlock live price trends, historical charts, supplier databases, cost curves, and analyst-backed insights across chemicals, agriculture, energy, packaging, and more. Use these tools to benchmark your contracts, plan budgets with confidence, and stay ahead of market moves on every product you buy.
0
+Products
0
+Regions
0
+Subscriptions
In Q2 2026, olive oil prices across European markets moved towards stabilization as improving Mediterranean supply conditions eased earlier cost concerns. Spain continued to dominate the regional market, with olive oil prices receiving support from better production availability and increased selling activity among producers. Spanish olive oil production through March 2026 reached approximately 1.28 million tonnes, significantly exceeding output levels recorded during previous low-production seasons. Italy maintained its strong market position amid improved domestic availability, although sourcing costs and competitive imports from Tunisia continued to influence market dynamics. Export demand remained supportive, with markets such as China and Brazil contributing to slightly higher trade flows across standard grades. Weather conditions remained a key factor towards the end of the quarter, as improved rainfall in Spain strengthened expectations for the upcoming crop. However, flowering conditions continued to require monitoring, as their impact on future harvest volumes could influence supply availability and price movements in the coming months.
Olive Oil is a liquid fat obtained from olives. With the melting point -6°C, boiling point 700°C and smoke point 190-215°C, 175°C, and 210°C for extra virgin, virgin, and refined olive oil, respectively, it is the most common vegetable oil.
People who consume an olive oil rich diet appear to have a higher life expectancy along with lower chances of dying from cardiovascular disease. Fresh olive oil has a pungent, fruity smell, while rancid olive oil has little smell or may smell like crayons or stale peanuts. It has a bitter taste with no fruitiness.
Cooking, Frying food , Cosmetics, Pharmaceuticals, Soaps, Traditional oil lamps, Skin care
Olea europaea l. fruit oil
Sovena Group, Mosselman S.A, Cargill, Incorporated, Archer Daniels Midland Company (Oilio®)
CurrencyUS$ (Data can also be provided in local currency)
Supplier Database AvailabilityYes
Customization ScopeThe report can be customized as per the requirements of the customer
Post-Sale Analyst Support360-degree analyst support after report delivery
Note: Our supplier search experts can assist your procurement teams in compiling and validating a list of suppliers indicating they have products, services, and capabilities that meet your company's needs.
Olive Oil is produced through the extraction of oil present in olive drupes. The oil is produced in the mesocarp cells, and stored in a specific kind of vacuole called a lipo vacuole. The extraction process involves separation of oil from other fruit contents, that is, vegetative extract liquid and solid material. This separation can be attained by physical means alone, that is, oil and water do not mix.
Our Price Analysis Methodology

Senior Business Insights Analyst
Delivering price trend analysis and procurement market insights at Procurement Resource, with expertise in identifying commodity patterns, supporting purchasing strategies, and improving cost efficiency through actionable market intelligence.

Experience how Procurement Resource transforms raw material price data into clear, decision ready intelligence. Optimise your performance with reliable, expert market data and analysis. Schedule your demo today to experience a live walk-through where our experts will showcase interactive price charts, forecasted prices, and insights driving the prices for your key commodities, tailored to your workflows. Contact us now!
Our Team will be happy to assist you
We are just a text away
Still Need Help?
This report presents a cost analysis of syngas production from heavy fuel (heavy hydrocarbons)
This report provides the cost structure of LPG production by the petroleum refining process. In this process, the crude oil recovered is separated into oil and wet gas via a gas trap.
This report provides the economy of producing ammonia by partial oxidation method.
Unlock full access to Procurement Resource's price databases, interactive charts, and short-term forecasts for thousands of commodities. Elevate your sourcing decisions by comparing prices across regions, downloading historical data, and layering in analyst-backed insights, all with our flexible plans that scale as your portfolio grows.
Still have any Questions
Contact Us



Price Trend Dashboard - What's Included
Price trends across a diverse portfolio of categories and products, spanning board to niche chemicals
Coverage extendable to grade-specific chemicals based on procurement requirements
Regular price tracking supported by robust historical datasets
News, policy updates, and key market drivers impacting price movements
Short-term and long-term price outlooks and forecasts
Supply–demand dynamics and capacity-driven market analysis

Track prices, market movements, supply-demand dynamics, and industry developments across hundreds of commodities through a centralized intelligence platform built for informed procurement decisions.

Understand market fluctuations using analyst-backed forecasts, historical pricing patterns, and evolving industry trends to strengthen sourcing strategies and budget planning.

Leverage cost models, pricing benchmarks, and procurement insights to evaluate purchasing opportunities, improve negotiations, and enhance operational efficiency.
Access region-specific price trends, trade activities, capacity changes, and supply chain developments influencing commodity markets worldwide.