Polyethylene (PE) Price Trend Analysis 2026: Price Drivers, Latest News, Market Insights, Supply Demand Analysis & Historical Prices

Udeesha Tomar profile photo
Written ByUdeesha Tomar

Procurement Resource Database

Laptop screen

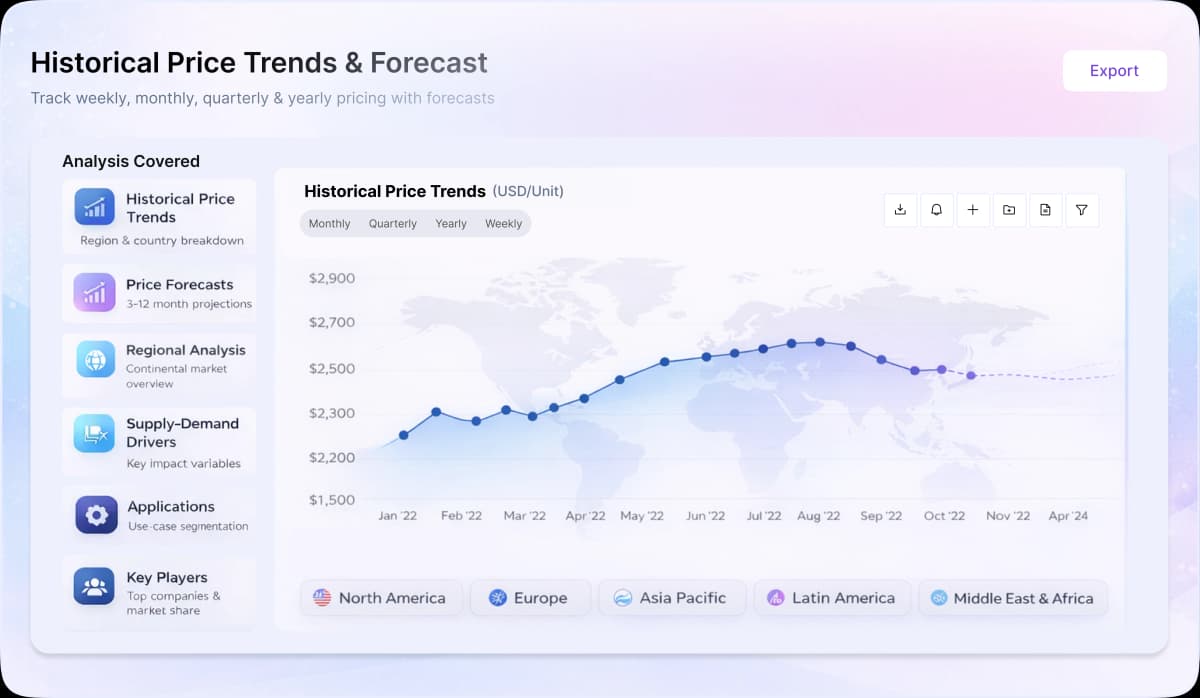
Turn price intelligence into action with the Procurement Resource Database. Log in or subscribe to unlock live price trends, historical charts, supplier databases, cost curves, and analyst-backed insights across chemicals, agriculture, energy, packaging, and more. Use these tools to benchmark your contracts, plan budgets with confidence, and stay ahead of market moves on every product you buy.

0

+

Products

0

+

Regions

0

+

Subscriptions

  • Global polyethylene (PE) prices followed a mixed trend during Q1’26 as firm Asian feedstock costs and supply tightening contrasted with oversupplied conditions in Western markets.
  • Feedstock ethylene prices remained supported by rising crude oil values, tighter cracker operating rates, and disruptions to nearly 20% of global oil and LNG trade flows through the Strait of Hormuz.
  • Downstream demand from packaging, construction, automotive, consumer goods, and industrial applications remained mixed, with Asia showing stronger import activity while Europe and North America faced weaker derivative demand.

Asia

Polyethylene (PE) prices in Asia moved upward during Q1’26, supported by tighter ethylene supply and firm downstream demand. Reduced operating rates at steam crackers and ongoing capacity rationalization across Japan and South Korea constrained regional olefin availability, increasing import dependence and competition for cargoes. In India, feedstock ethylene prices increased by ~5% between February and March 2026 due to constrained regional supply, elevated crude oil prices, and higher import dependence. The Iran war and Strait of Hormuz disruptions significantly increased production and freight costs, while anticipated OPEC+ output reductions and limited strategic reserve coverage tightened market sentiment. Demand from packaging films, consumer goods, pipes, and industrial plastic applications remained stable during the quarter.

Europe

The European PE market remained subdued during Q1’26 due to persistent structural oversupply and weak downstream industrial activity. Ethylene cracker utilization rates remained near 75% during 2025, while continued imports of olefins and polymer derivatives pressured domestic producers. Economic uncertainty, inflationary pressure, and weak manufacturing activity limited demand from construction materials, automotive components, and industrial packaging sectors. However, elevated crude oil and freight costs linked to Strait of Hormuz disruptions prevented sharper PE price declines by increasing overall production and logistics expenses across the regional petrochemical sector.

North America

North American polyethylene markets remained largely stable-to-soft during Q1’26 amid oversupply and subdued downstream demand. However, rising ethane and natural gas feedstock costs provided support to regional PE pricing. Strong global demand for feedstocks and new cracker startups in Asia and Mexico compressed producer margins toward breakeven levels, increasing pressure on operating economics. Demand from packaging, consumer goods, and industrial plastic applications remained moderate, while elevated energy and transportation costs linked to geopolitical disruptions continued influencing market sentiment.

About Polyethylene (PE)

Polyethylene (PE), a synthetic thermoplastic resin, is produced from ethylene and is the one of the most common plastic type. Its is primarily utilised in packaging and production of plastic bags, plastic films, geomembranes, containers including bottles, etc. It is a combination of similar polymers of ethylene with various values of n. Its branched versions are called as low-density polyethylene (LDPE) while its linear versions are called high-density polyethylene (HDPE) and ultrahigh-molecular-weight polyethylene (UHMWPE).

Polyethylene (PE) Product Detail

Chemical Formula

(C2H4)n

Industrial Uses

Plastic Containers, Plastic Bottles, Plastic Films, Bags

Synonyms

9002-88-4, Polyethene, poly(methylene)

Supplier Database

Saudi Basic Industries Corporation (SABIC), Exxon Mobil Corporation, The Dow Chemical Company, China Petroleum & Chemical Corporation (Sinopec), PetroChina Company Limited, Reliance Industries Limited (RIL), Chevron Phillips Chemical Company

Regional Coverage

Asia Pacific

China, India, Indonesia, Pakistan, Bangladesh, Japan, Philippines, Vietnam, Iran, Thailand, South Korea, Iraq, Saudi Arabia, Malaysia, Nepal, Taiwan, Sri Lanka, UAE, Israel, Hongkong, Singapore, Oman, Kuwait, Qatar, Australia, and New Zealand

Europe

Germany, France, United Kingdom, Italy,Spain, Russia, Turkey, Netherlands, Poland, Sweden, Belgium, Austria, Ireland Switzerland, Norway, Denmark, Romania, Finland, Czech Republic, Portugal and Greece

North America

United States and Canada

Latin America

Brazil, Mexico, Argentina, Columbia, Chile, Ecuador, and Peru

Africa

South Africa, Nigeria, Egypt, Algeria, Morocco

CurrencyUS$ (Data can also be provided in local currency)

Supplier Database AvailabilityYes

Customization ScopeThe report can be customized as per the requirements of the customer

Post-Sale Analyst Support360-degree analyst support after report delivery

Note: Our supplier search experts can assist your procurement teams in compiling and validating a list of suppliers indicating they have products, services, and capabilities that meet your company's needs.

Polyethylene (PE) Production Process

  • Production of Polyethylene (PE) via Polymerisation

Polyethylene is produced from ethylene through its polymerisation. As ethylene is a stable compound, it polymerises only upon its contact with a catalyst. This conversion is highly exothermic and finally produces Polyethylene.


Our Price Analysis Methodology

About the Author

Udeesha Tomar profile photo

Udeesha Tomar

AVP - Strategy and Solutions

Leading procurement research solutions across chemicals, materials, and food & beverages, with expertise in price forecasting and market analytics.

Schedule Demo

Schedule A Demo

Experience how Procurement Resource transforms raw material price data into clear, decision ready intelligence. Optimise your performance with reliable, expert market data and analysis. Schedule your demo today to experience a live walk-through where our experts will showcase interactive price charts, forecasted prices, and insights driving the prices for your key commodities, tailored to your workflows. Contact us now!

Our Team will be happy to assist you

We are just a text away

+1

Still Need Help?

Europe & Africa

+44 7573 171117

Sales@procurementresource.com

USA & Canada

+1 307 363 1045

Sales@procurementresource.com

APAC

+91 8850629517

Sales@procurementresource.com

Unlock full access to Procurement Resource's price databases, interactive charts, and short-term forecasts for thousands of commodities. Elevate your sourcing decisions by comparing prices across regions, downloading historical data, and layering in analyst-backed insights, all with our flexible plans that scale as your portfolio grows.

Still have any Questions

Contact Us
Mastercard
Wire
VISA
Stripe

Why Procurement Database

Commodity Market Intelligence

Commodity Market Intelligence

Track prices, market movements, supply-demand dynamics, and industry developments across hundreds of commodities through a centralized intelligence platform built for informed procurement decisions.

Price Forecasts & Market Outlooks

Price Forecasts & Market Outlooks

Understand market fluctuations using analyst-backed forecasts, historical pricing patterns, and evolving industry trends to strengthen sourcing strategies and budget planning.

Cost & Procurement Optimization

Cost & Procurement Optimization

Leverage cost models, pricing benchmarks, and procurement insights to evaluate purchasing opportunities, improve negotiations, and enhance operational efficiency.

Global & Regional Market Insights

Global & Regional Market Insights

Access region-specific price trends, trade activities, capacity changes, and supply chain developments influencing commodity markets worldwide.

1/4