Sugar Prices Tumble on Oil Drop
Sugar fell sharply to 1-week lows as a 5% plunge in crude oil undercut ethanol prices, potentially boosting sugar supplies. The outlook for ample global supply remains bearish.

Sugar fell sharply to 1-week lows as a 5% plunge in crude oil undercut ethanol prices, potentially boosting sugar supplies. The outlook for ample global supply remains bearish.
Duty-free imports of raw sugar and the release of previously export-allocated refined sugar stocks into the domestic Indian market have significantly increased supply availability. Ex-mill prices have already fallen sharply, and industry bodies expect retail prices to follow as the festive season approaches.
| Product | Region | Incoterm Basis | Price | Last Updated Month |
|---|---|---|---|---|
| Refined Sugar | European Union | EXW | USD 575.52/MT | July 2026 |
| Refined Sugar | India | EXW | USD 478.41/MT | July 2026 |
| Refined Sugar | China | CIF | USD 498.41/MT | July 2026 |
| Refined Sugar | Australia | CIF | USD 532.41/MT | July 2026 |
| Refined Sugar | Germany | CIF | USD 575.52/MT | July 2026 |
| Refined Sugar | European Union | EXW | USD 580.09/MT | June 2026 |
| Refined Sugar | India | EXW | USD 479.01/MT | June 2026 |
| Refined Sugar | China | CIF | USD 673.54/MT | June 2026 |
| Refined Sugar | Australia | CIF | USD 701.57/MT | June 2026 |
| Refined Sugar | Germany | CIF | USD 610.09/MT | June 2026 |
Stay updated with the latest Refined Sugar prices, historical data, and tailored regional analysis
Asia
In China, refined sugar averaged 674 USD/MT (CIF) in June’26. The Asian market showed divergent trends during Q2 as China faced sufficient domestic availability and competitive import flows, limiting upward movement. Domestic consumption from beverage, confectionery and food-processing industries remained steady, but supply availability kept buying activity balanced. China’s refined sugar market remained relatively stable, with international trade flows adjusting according to global supply conditions. India moved differently, with refined sugar reaching 479 USD/MT (EXW) in June’26 as export restrictions and domestic supply management supported the market. The Indian government extended restrictions on raw, white and refined sugar exports until September 30, 2026, reducing surplus availability and supporting domestic market stability.
Europe
In the European Union, refined sugar changed hands at an average of 580 USD/MT (EXW) through June'26, while Germany saw refined sugar average 610 USD/MT (CIF) over the course of June'26. European refined sugar markets remained under pressure during parts of Q2 due to improved supply expectations and cautious buyer activity. Later in the quarter, sentiment improved as supply concerns and futures movements provided some support. Production expectations for the 2026/27 season remained a key factor influencing market direction, with regional availability varying across major beet-growing countries. Import flows and inventory management also shaped purchasing decisions as buyers balanced near-term requirements with future supply expectations.
North America
North American refined sugar markets remained supported during Q2 2026 due to stable availability and controlled import flows. Domestic availability continued to be influenced by quota-based imports and production conditions, limiting exposure to global market fluctuations. Buyers maintained cautious procurement strategies as they balanced inventory levels with uncertain supply expectations. Strong participation in sugar futures markets reflected continued attention from traders and commercial users, while stable consumption from confectionery, bakery and beverage industries provided underlying support.
Analyst Insight
According to Procurement Resource, refined sugar prices are expected to remain stable to firm, with supply management policies, production outlook and trade flows continuing to influence regional pricing.
Related Report
Need Latest Refined Sugar Prices?
Get real-time price assessments, periodic trends, forecasts and price driver insights across key global markets.
Our Clients


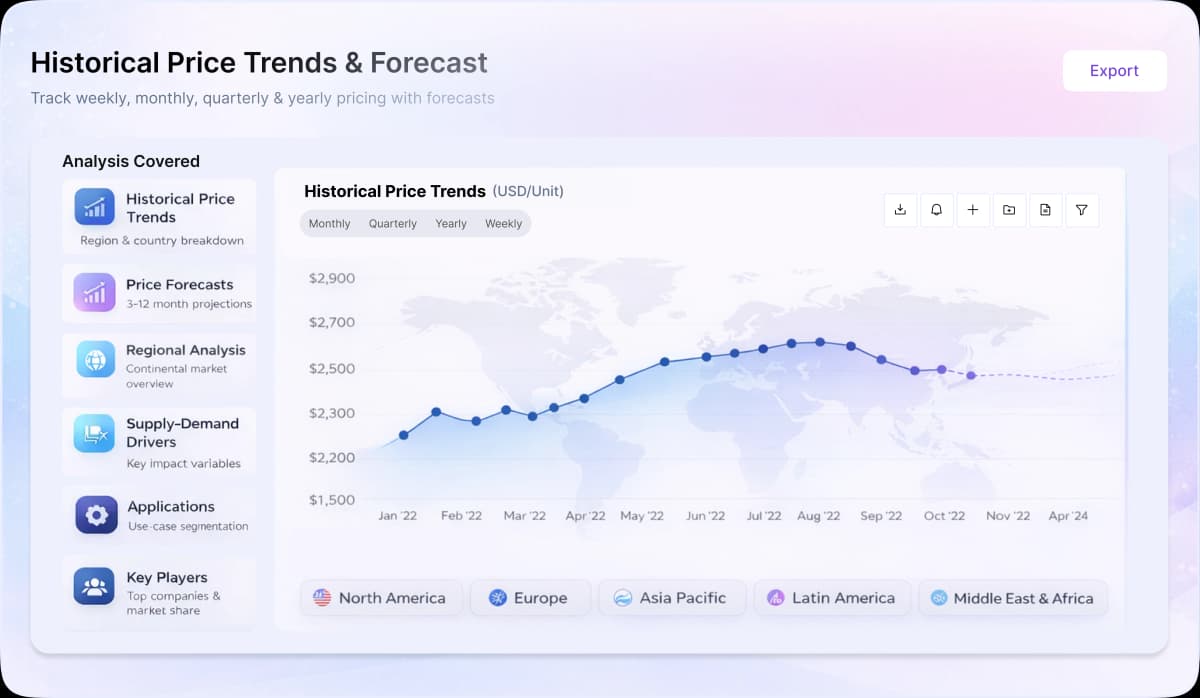
Turn price intelligence into action with the Procurement Resource Database. Log in or subscribe to unlock live price trends, historical charts, supplier databases, cost curves, and analyst-backed insights across chemicals, agriculture, energy, packaging, and more. Use these tools to benchmark your contracts, plan budgets with confidence, and stay ahead of market moves on every product you buy.
0
+Products
0
+Regions
0
+Subscriptions
Asia
In Asia, refined sugar prices increased from ~5.27 RMB/kg (Spot FD) in January to ~5.43 RMB/kg (Spot FD) in March. This quarter average prices were lower by ~1.88% compared with Q4’25, while prices increased by ~2.93% between January and March. The market initially weakened due to sufficient regional supply and improved global availability; however, prices recovered later as higher freight and energy costs increased import expenses across Asian markets. India approved additional sugar export volumes during the quarter, while mills reportedly booked nearly 100,000 metric tons of export deals within a week during March amid improving overseas demand and rising global prices. Strait of Hormuz disruptions also increased freight and bunker fuel costs, tightening trade flows across regional sugar supply chains.
Europe
European refined sugar prices increased from ~0.74 EUR/kg (Spot FD) in January to ~0.77 EUR/kg (Spot FD) in March. Q1’26 average prices were lower by ~0.31% compared with Q4’25, while prices increased by ~3.81% from January to March. The market remained supported by elevated freight costs and logistical disruptions linked to the Iran conflict, which increased landed costs for imported sugar cargoes and agricultural commodities. However, comfortable regional inventories and weak industrial sweetener demand prevented sharper price increases across the quarter. Demand from confectionery, beverages, and processed food sectors remained stable-to-moderate.
South America
In Brazil, refined sugar prices declined from ~3.24 BRL/kg (Spot FD) in January to ~3.12 BRL/kg (Spot FD) in March. This quarter average prices were lower by ~11.21% compared with the previous quarter, while prices decreased by ~3.80% between January and March. The Brazilian market remained pressured by strong export availability and sufficient sugarcane supply during the quarter. However, rising crude oil prices linked to the Iran war increased expectations of greater ethanol diversion, limiting sharper declines in sugar prices. Export competitiveness remained strong despite elevated marine freight and insurance costs caused by Strait of Hormuz shipping disruptions.
Refined Sugar, that we consume, is basically produced from crops like sugar cane or sugar beets. These sugar canes and beet undergo a defecation process to derive the sugar. It is generally found as sucrose, that is the combination of glucose and fructose.
Sweetener, Taste Enhancer, Candies, Chocolates, Maple Syrups, Donuts, Dairy Products, Ice Creams
Cargill, Incorporated, Associated British Foods plc (ABF) (AB Sugar), Domino Foods, Inc. (C&H®? Sugar brand), Tate & Lyle Sugars, Sidul Açúcares, Triveni Engineering & Industries Ltd.
CurrencyUS$ (Data can also be provided in local currency)
Supplier Database AvailabilityYes
Customization ScopeThe report can be customized as per the requirements of the customer
Post-Sale Analyst Support360-degree analyst support after report delivery
Note: Our supplier search experts can assist your procurement teams in compiling and validating a list of suppliers indicating they have products, services, and capabilities that meet your company's needs.
Refining of sugar takes place in 2 steps, that is, Affination and Screening. While during affination raw sugar is mixed with heavy syrup and centrifuged to wash away the outer coating of the raw sugar crystals, in screening, raw sugar is dissolved to make a syrup (about 70% by weight solids), that is also clarified by adding phosphoric acid and calcium hydroxide.
Our Price Analysis Methodology

Manager - Market Research
Delivering market research and procurement intelligence at Procurement Resource with a focus on economic forecasting, commodity analysis, and client advisory to help sourcing teams make data-backed purchasing decisions.

Experience how Procurement Resource transforms raw material price data into clear, decision ready intelligence. Optimise your performance with reliable, expert market data and analysis. Schedule your demo today to experience a live walk-through where our experts will showcase interactive price charts, forecasted prices, and insights driving the prices for your key commodities, tailored to your workflows. Contact us now!
Our Team will be happy to assist you
We are just a text away
Still Need Help?
Europe & Africa
+44 7573 171117
Sales@procurementresource.com
USA & Canada
+1 307 363 1045
Sales@procurementresource.com
APAC
+91 8850629517
Sales@procurementresource.com
This report presents a detailed cost analysis of bio-ethanol production from sugarcane using the fermentation process.
This report presents a detailed cost analysis of bio-butadiene production from raw sugar using an aerobic fermentation process.
The report is a detailed study of economics of production of oxalic acid by the reaction of nitric acid with glucose/ sugar.
This report presents a detailed cost analysis of isobutanol production from raw sugar via fermentation process.
Hydrotalcite Manufacturing Plant Project Report thoroughly focuses on every detail that encompasses the cost of manufacturing. Our extensive cost model meticulously covers breaking down expenses around raw materials, labour, technology, and manufacturing expenses. This enables precise cost structure optimization and helps in identifying effective strategies to reduce the overall cash cost of manufacturing.
Unlock full access to Procurement Resource's price databases, interactive charts, and short-term forecasts for thousands of commodities. Elevate your sourcing decisions by comparing prices across regions, downloading historical data, and layering in analyst-backed insights, all with our flexible plans that scale as your portfolio grows.
Still have any Questions
Contact Us



Price Trend Dashboard - What's Included
Price trends across a diverse portfolio of categories and products, spanning board to niche chemicals
Coverage extendable to grade-specific chemicals based on procurement requirements
Regular price tracking supported by robust historical datasets
News, policy updates, and key market drivers impacting price movements
Short-term and long-term price outlooks and forecasts
Supply–demand dynamics and capacity-driven market analysis

Track prices, market movements, supply-demand dynamics, and industry developments across hundreds of commodities through a centralized intelligence platform built for informed procurement decisions.

Understand market fluctuations using analyst-backed forecasts, historical pricing patterns, and evolving industry trends to strengthen sourcing strategies and budget planning.

Leverage cost models, pricing benchmarks, and procurement insights to evaluate purchasing opportunities, improve negotiations, and enhance operational efficiency.
Access region-specific price trends, trade activities, capacity changes, and supply chain developments influencing commodity markets worldwide.