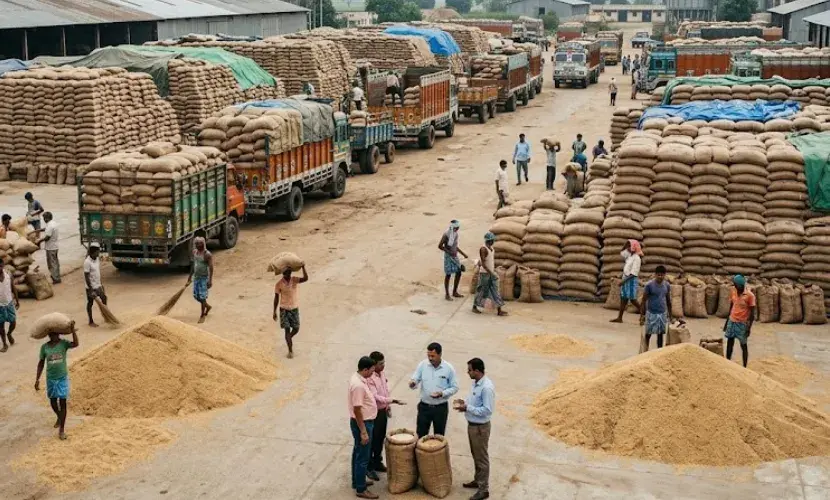
Rice Price Trend H1 2026
- Global rice prices were mixed in H1’26, with Asia showing split movement as India’s ample supply capped gains, while Thailand, Vietnam, and Pakistan saw firmer export quotes.
- Upstream pressure came from fertilizer, fuel, freight, and insurance costs after the Iran war and Strait of Hormuz disruption raised landed-cost risks for food importers.
- Downstream demand stayed firm from food security buying, public distribution needs, and import demand from Asia, Europe, and North America.
Asia
In Asia, rice prices exhibited a mixed trend during H1’26, reflecting divergent supply-demand dynamics across key exporting countries. India maintained relatively stable export prices, supported by ample domestic availability and strong production levels. In contrast, Thailand, Vietnam, and Pakistan experienced firmer export pricing, driven by tighter supply conditions and sustained international demand. According to USDA estimates, India’s rice exports for 2026/27 are projected at 25.0 million MT, significantly exceeding Vietnam at 8.0 million MT, Thailand at 7.5 million MT, and Pakistan at 5.0 million MT. India’s robust production, estimated at 154.0 million MT for 2025/26, continued to exert a moderating influence on regional price movements. Demand remained resilient, particularly from major importers such as the Philippines, Vietnam, and China, with projected imports of 5.6 million MT, 4.0 million MT, and 3.3 million MT, respectively, for 2026/27.
Europe
In Europe, rice prices were primarily influenced by import dependency, freight dynamics, and supplier availability rather than domestic production factors. The USDA projects EU rice imports at 2.35 million MT for 2026/27, while exports are estimated at 410,000 MT, underscoring the region’s reliance on external supply. Elevated freight and insurance costs, exacerbated by disruptions in the Strait of Hormuz, contributed to increased landed costs, particularly for Asian-origin rice. Despite these pressures, demand remained stable across retail and foodservice segments, supported by consistent consumption patterns.
North America
In North America, U.S. rice prices were shaped by declining export competitiveness alongside emerging supply-side constraints. The USDA revised down its 2025/26 U.S. long-grain export forecast to 50.0 million cwt, reflecting subdued international demand. Mexico’s rice imports declined by approximately 20.0% during the first seven months of its 2025/26 marketing year, while the U.S. market share weakened as Brazil and Uruguay expanded their presence. Additionally, reduced long-grain acreage and elevated input costs in the U.S. contributed to a more supportive outlook for forward prices, indicating potential upward pressure in the near term.
Analyst Insight
According to Procurement Resource, near term, rice prices may remain mixed. India’s ample supply can cap gains, but fertilizer, freight, and tighter U.S. and Thai acreage may limit downside.