

Udeesha Tomar
AVP - Strategy and Solutions
Leading procurement research solutions across chemicals, materials, and food & beverages, with expertise in price forecasting and market analytics.

Asia
During the Q4’25, the prices of Tartaric Acid in Asia experienced mixed price movements. The prices were impacted by the changing scenario in the grape segment. The grape crop was impacted by heavy and unusual rainfall patterns in India. On the other hand, the demand for tartaric acid was average rather than robust, especially for the food, beverage, and pharmaceutical industries, as the buyers waited for the supply scenario to become clearer. The prices, therefore, increased slightly during the period under review.
Europe
The prices of Tartaric Acid in Europe were under pressure in Q4’25. There was an oversupply of white wine grapes in the major producing regions, which increased the pressure on the prices of wine production. Though the prices of grapes normally have a positive impact on the prices of raw materials used in the production of tartaric acid, the crisis in the wine industry reduced the overall sentiment in the market. The purchasing activity in the food and beverage industry was low, and the buyers were only buying the required amounts of the product. There were sufficient inventory levels in the market, and the prices were stable or slightly lower at the end of the quarter due to the low purchasing activity.
North America
Tartaric Acid prices in North America show a steady to slightly firmer trend in Q4’25. There were some issues reported by the regions regarding the sale of grapes, as the growers of the grapes have been facing difficulties in finding buyers. This indicated that the supply of grapes was higher, but the processing and trade regulations impacted the flow of the market. The demand was steady from the food processing, bakery, and beverage sectors, as the buyers were cautious of stockpiling the product and were maintaining their routine buying habits.
Analyst Insight
According to Procurement Resource, Tartaric Acid prices are expected to remain stable in the early part of 2026, depending on the global conditions of the grape harvest and the wine industry.
Related Report
Need Latest Tartaric Acid Prices?
Get real-time price assessments, periodic trends, forecasts and price driver insights across key global markets.
Our Clients


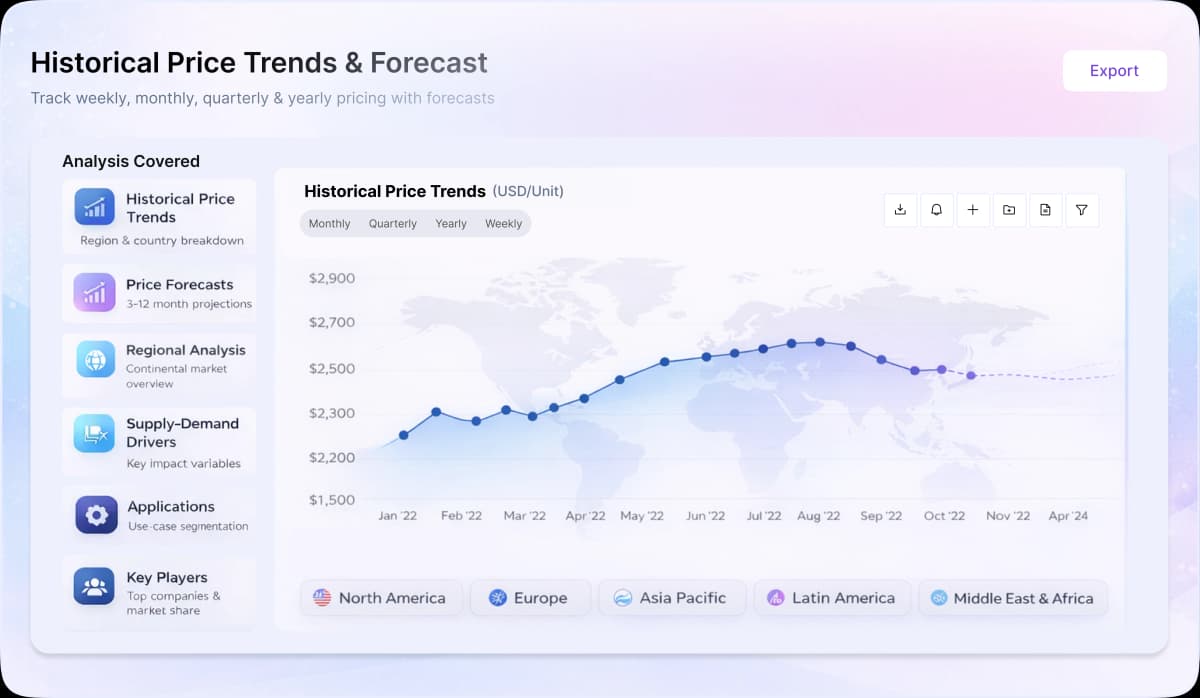
Turn price intelligence into action with the Procurement Resource Database. Log in or subscribe to unlock live price trends, historical charts, supplier databases, cost curves, and analyst-backed insights across chemicals, agriculture, energy, packaging, and more. Use these tools to benchmark your contracts, plan budgets with confidence, and stay ahead of market moves on every product you buy.
0
+Products
0
+Regions
0
+Subscriptions
Asia
In Asia, tartaric acid prices weakened during the third quarter of 2025 due to abundant supply and subdued industrial demand. Production levels stayed high as manufacturers benefited from steady availability of key raw materials and lower feedstock costs. Exports from major Asian producers increased, but global buying interest remained limited amid cautious trade sentiment.
The chemical, widely used in food, beverages, and pharmaceuticals, saw slower consumption as consumer spending in these sectors stayed modest. Additionally, ongoing trade tensions and oversupply in related acid markets weighed on export sentiment. With distributors holding sufficient inventories and downstream industries purchasing conservatively, regional prices trended downward through most of the quarter.
Europe
In Europe, tartaric acid markets also softened through Q3’25. Despite moderate seasonal demand from the wine and food industries, overall consumption did not rise enough to counter weak market fundamentals. Weather-related challenges in southern Europe affected grape production, slightly tightening local raw material supply, but this did not have a strong impact on overall pricing since imports from Asia remained readily available and competitively priced. European producers faced pressure from lower-cost overseas material, while high energy costs and slower manufacturing activity kept margins thin. Buyers remained hesitant to commit to large purchases, relying instead on existing stock, leading to a steady-to-soft trend in pricing.
North America
In North America, tartaric acid prices showed a mild decline through the quarter. Import volumes from Asia increased, putting downward pressure on local offers. Domestic demand from the food and beverage sectors was stable but not strong enough to support higher prices, while pharmaceutical and industrial applications continued to see cautious buying. Improved logistics and eased port congestion allowed for smoother imports, which further contributed to comfortable supply conditions. The combination of high availability and moderate end user activity kept the overall market subdued, with prices remaining range-bound or slightly weaker.
Analyst Insight
According to Procurement Resource, Tartaric Acid prices are expected to stay mildly weak into Q4’25, with any recovery hinging on improved seasonal demand and tighter raw material availability.
Tartaric acid is an organic acid that occurs naturally in fruits, especially grapes. It has a sour taste and is a white, crystalline substance. C4H6O6 is its chemical formula. D-tartaric acid and L-tartaric acid are the two optically active enantiomers of tartaric acid. It is frequently employed as an acidulant and flavoring agent in the food and beverage sector. Tartaric acid is also used in the pharmaceutical business to improve the stability and pH of medications. Because of its chiral nature, it is used in chiral synthesis and as a chemical resolving agent to separate enantiomers.
C4H6O6
Metal Cleaning, Electroplating, Chiral synthesis, Textile production, Cosmetics, Wine production
Distillerie Mazzari S.p.A., Comercial Quimica Sarasa S.L., Alvinesa, Tartaros Gonzalo Castella, SL, Industria Chimica Valenzana S.P.A, Thirumalai Chemicals Ltd, Legre-Mante S.A.
(2R,3R)-2,3-dihydroxybutanedioic acid
CurrencyUS$ (Data can also be provided in local currency)
Supplier Database AvailabilityYes
Customization ScopeThe report can be customized as per the requirements of the customer
Post-Sale Analyst Support360-degree analyst support after report delivery
Note: Our supplier search experts can assist your procurement teams in compiling and validating a list of suppliers indicating they have products, services, and capabilities that meet your company's needs.
In this technique, grapes are first treated to give in liquid and solid state. The dregs in solid state are subjected to additional grinding and fermenting processes with liquid dregs to produce vinasse. Along with potassium bitartrate and calcium chloride, calcium tartrate is also removed from the vinasse and crystallized. To produce tartaric acid, the resultant product is dried, concentrated continuously, and concentrated intermittently.
Our Price Analysis Methodology
AVP - Strategy and Solutions
Leading procurement research solutions across chemicals, materials, and food & beverages, with expertise in price forecasting and market analytics.

Experience how Procurement Resource transforms raw material price data into clear, decision ready intelligence. Optimise your performance with reliable, expert market data and analysis. Schedule your demo today to experience a live walk-through where our experts will showcase interactive price charts, forecasted prices, and insights driving the prices for your key commodities, tailored to your workflows. Contact us now!
Our Team will be happy to assist you
We are just a text away
Still Need Help?
Unlock full access to Procurement Resource's price databases, interactive charts, and short-term forecasts for thousands of commodities. Elevate your sourcing decisions by comparing prices across regions, downloading historical data, and layering in analyst-backed insights, all with our flexible plans that scale as your portfolio grows.
Still have any Questions
Contact Us



Price Trend Dashboard - What's Included
Price trends across a diverse portfolio of categories and products, spanning board to niche chemicals
Coverage extendable to grade-specific chemicals based on procurement requirements
Regular price tracking supported by robust historical datasets
News, policy updates, and key market drivers impacting price movements
Short-term and long-term price outlooks and forecasts
Supply–demand dynamics and capacity-driven market analysis

Track prices, market movements, supply-demand dynamics, and industry developments across hundreds of commodities through a centralized intelligence platform built for informed procurement decisions.

Understand market fluctuations using analyst-backed forecasts, historical pricing patterns, and evolving industry trends to strengthen sourcing strategies and budget planning.

Leverage cost models, pricing benchmarks, and procurement insights to evaluate purchasing opportunities, improve negotiations, and enhance operational efficiency.
Access region-specific price trends, trade activities, capacity changes, and supply chain developments influencing commodity markets worldwide.