Oil Prices Rise, Fueling Inflation Concerns
Crude oil prices are rising, adding pressure to domestic inflation. The volatility is expected to continue influencing commodity market trends.

Crude oil prices are rising, adding pressure to domestic inflation. The volatility is expected to continue influencing commodity market trends.
The conflict between the U.S., Israel and Iran has disrupted oil flows through the Strait of Hormuz, pushing up crude oil prices. Higher crude costs have lifted gasoline and diesel prices, contributing to broader inflation. Supply constraints are expected to keep prices elevated until mid‑2027.
| Product | Region | Incoterm Basis | Price | Last Updated Month |
|---|---|---|---|---|
| Kerosene | USA | FOB | USD 1,494.56/MT | August 2026 |
| Kerosene | Saudi Arabia | FOB | USD 1,206.66/MT | August 2026 |
| Kerosene | Japan | FOB | USD 1,202.69/MT | August 2026 |
| Kerosene | Singapore | FOB | USD 1,169.77/MT | August 2026 |
| Kerosene | Canada | FOB | USD 1,138.79/MT | August 2026 |
| Kerosene | USA | FOB | USD 1,165.56/MT | July 2026 |
| Kerosene | Saudi Arabia | FOB | USD 1,024.46/MT | July 2026 |
| Kerosene | Japan | FOB | USD 1,013.57/MT | July 2026 |
| Kerosene | Singapore | FOB | USD 1,209.46/MT | July 2026 |
| Kerosene | Canada | FOB | USD 1,180.09/MT | July 2026 |
Stay updated with the latest Kerosene prices, historical data, and tailored regional analysis
Asia
In Saudi Arabia, the average price of Kerosene rose from ~USD 1,024.46/MT (FOB) in July to ~USD 1,206.66/MT in August, an increase of ~17.8%. Japan saw a similar gain of about 18.7%, from ~USD 1,013.57/MT (FOB) to ~USD 1,202.69/MT. Prices had eased in early July after an interim US–Iran peace deal, but the agreement collapsed and the Strait of Hormuz blockade continued. Gulf oil production shut in by the disruption rose to 6.7 million b/d in August, while attacks in the Red Sea cut Saudi exports from Yanbu, tightening regional supply. Indian state oil companies raised jet fuel prices in both August and September, following international benchmarks.
Europe
European kerosene markets dipped briefly in mid-August, as demand weakened after the summer travel peak and jet fuel imports climbed to about 750,000 b/d in June and July. Prices then rebounded strongly in September, making Europe the highest-priced region. The region relies heavily on Middle East jet fuel imports, which left it exposed to continued Hormuz disruption.
North America
In the USA, average kerosene prices jumped from nearly USD 1,165.56/MT (FOB) in July to roughly USD 1,494.56/MT in August, up ~28.2%. Canada moved the other way, easing about 3.5% from ~USD 1,180.09/MT (FOB) to ~USD 1,138.79/MT, as regional refiners increased distillate output and summer demand peaked. US prices rose as crude costs climbed, and EIA data showed distillate inventories 14% below the five-year average in late August. Refinery outages in Russia, China and the Middle East also kept export demand for US product strong.
Analyst Insight
According to Procurement Resource, kerosene prices are likely to stay high as shipping disruptions and low inventories continue into the heating season, though improved refinery output may ease some pressure.
Related Report
Need Latest Kerosene Prices?
Get real-time price assessments, periodic trends, forecasts and price driver insights across key global markets.
Our Clients


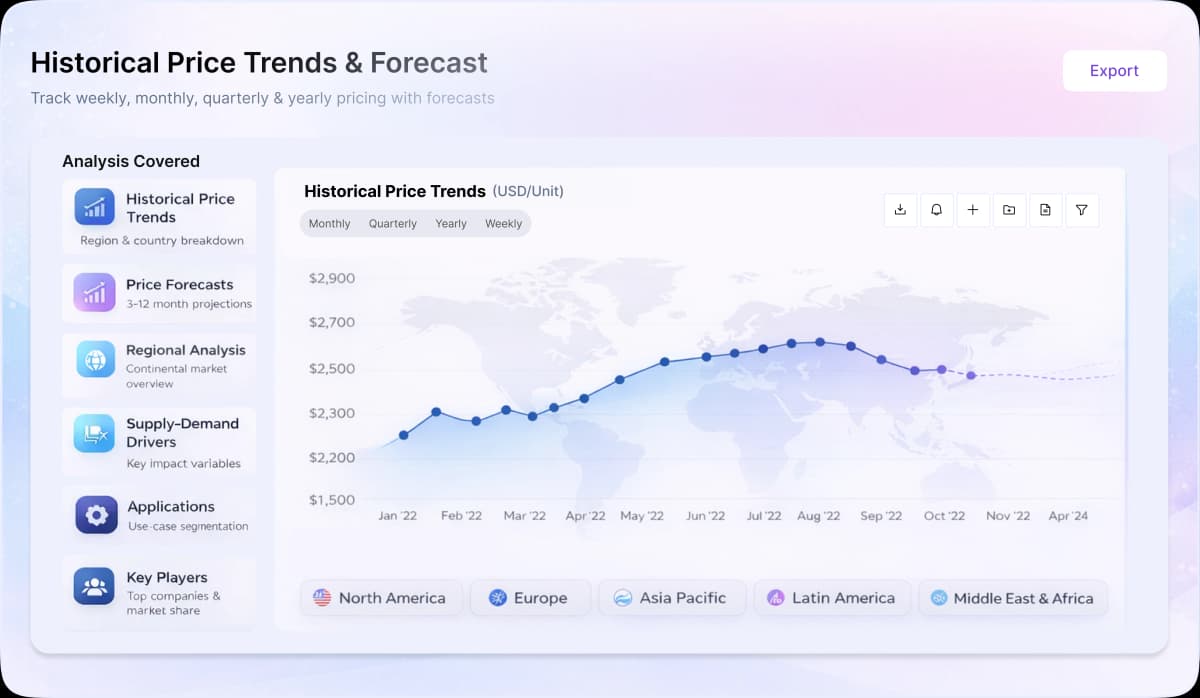
Turn price intelligence into action with the Procurement Resource Database. Log in or subscribe to unlock live price trends, historical charts, supplier databases, cost curves, and analyst-backed insights across chemicals, agriculture, energy, packaging, and more. Use these tools to benchmark your contracts, plan budgets with confidence, and stay ahead of market moves on every product you buy.
0
+Products
0
+Regions
0
+Subscriptions
Asia
In Saudi Arabia, the prices of Kerosene were ~SAR 4.90/kg in April and ~SAR 3.93/kg in May, showing a ~19.8% decrease. In Japan, the prices of Kerosene were ~JPY 214.95/kg in April and ~JPY 179.02/kg in the following month, showing a ~16.7% decrease. Asian kerosene prices corrected after the April spike as buyers resisted high levels and aviation demand softened. The market had risen sharply earlier because Asian crude imports were expected to fall 22% year-on-year in April, reducing refinery feedstock availability. Refinery runs were also lower, cutting jet fuel and kerosene output. However, weaker airline schedules, reduced seat-capacity growth, and lower fuel demand allowed May prices to fall.
Europe
Europe’s kerosene market stayed tight in Q2’26 because the region depends heavily on imported aviation kerosene. Regional refineries produced around 1.1 million b/d against consumption of about 1.6 million b/d, leaving a structural import gap. The loss of Middle East cargoes in April lifted risk premiums sharply. Prices later eased as alternative supply flows improved, but the market did not fully normalize because summer travel demand was approaching and import dependence remained high. Strategic reserves reduced immediate panic, but spot buyers stayed cautious due to route disruption and high replacement costs.
North America
North America was comparatively better supplied because domestic refinery runs stayed strong. U.S. refineries processed 17.1 million b/d of crude in the week ending June 19, with utilization at 96.1%, helping protect kerosene-type jet fuel availability. Demand was also more balanced, with jet fuel implied demand rising slightly year-on-year over the prior four weeks. However, the market still corrected in June as the global supply panic eased. The West Coast remained the most exposed area because it competes with Asia for imported barrels.
Kerosene is one of the most common combustible hydrocarbon liquid. It is derived from petroleum. It is extensively utilised as a fuel in aviation and households. Kerosene is also known for its low viscosity. It is a clear liquid that is formed from hydrocarbons obtained from the fractional distillation of petroleum.
CxHy (mixture of hydrocarbons)
Jet engines, Rocket engines, Cooking fuel, Lighting and heating fuel, Extraction process, Solvent, Lubricant
Paraffin, Lamp Oil, Coal Oil, Heating oil
Royal Dutch Shell (Shell), Chevron Corporation, Exxon Mobil Corporation , BP p.l.c., LUKOIL
CurrencyUS$ (Data can also be provided in local currency)
Supplier Database AvailabilityYes
Customization ScopeThe report can be customized as per the requirements of the customer
Post-Sale Analyst Support360-degree analyst support after report delivery
Note: Our supplier search experts can assist your procurement teams in compiling and validating a list of suppliers indicating they have products, services, and capabilities that meet your company's needs.
In this process, after the extraction of crude oil from the earth’s surface, it is heated to separate the components and obtain Kerosene via evaporation. This is followed by condensation and purification of Kerosene.
Our Price Analysis Methodology

Senior Business Insights Analyst
Delivering price trend analysis and procurement market insights at Procurement Resource, with expertise in identifying commodity patterns, supporting purchasing strategies, and improving cost efficiency through actionable market intelligence.

Experience how Procurement Resource transforms raw material price data into clear, decision ready intelligence. Optimise your performance with reliable, expert market data and analysis. Schedule your demo today to experience a live walk-through where our experts will showcase interactive price charts, forecasted prices, and insights driving the prices for your key commodities, tailored to your workflows. Contact us now!
Our Team will be happy to assist you
We are just a text away
Still Need Help?
This report presents a detailed cost analysis of dicyclopentadiene production from a crude C5s stream.
This report provides the cost structure of kerosene production by the fractional distillation process. In this process, first, the crude oil is extracted from the earth.
This report provides the cost structure of LPG production by the petroleum refining process. In this process, the crude oil recovered is separated into oil and wet gas via a gas trap.
Unlock full access to Procurement Resource's price databases, interactive charts, and short-term forecasts for thousands of commodities. Elevate your sourcing decisions by comparing prices across regions, downloading historical data, and layering in analyst-backed insights, all with our flexible plans that scale as your portfolio grows.
Still have any Questions
Contact Us



Price Trend Dashboard - What's Included
Price trends across a diverse portfolio of categories and products, spanning board to niche chemicals
Coverage extendable to grade-specific chemicals based on procurement requirements
Regular price tracking supported by robust historical datasets
News, policy updates, and key market drivers impacting price movements
Short-term and long-term price outlooks and forecasts
Supply–demand dynamics and capacity-driven market analysis

Track prices, market movements, supply-demand dynamics, and industry developments across hundreds of commodities through a centralized intelligence platform built for informed procurement decisions.

Understand market fluctuations using analyst-backed forecasts, historical pricing patterns, and evolving industry trends to strengthen sourcing strategies and budget planning.

Leverage cost models, pricing benchmarks, and procurement insights to evaluate purchasing opportunities, improve negotiations, and enhance operational efficiency.
Access region-specific price trends, trade activities, capacity changes, and supply chain developments influencing commodity markets worldwide.