Magnesium Prices Consolidate Amid Production Cuts
Magnesium prices fell to a low range as smelters cut output and cost pressures rise. Inventory levels rise, but supply contraction signals may push prices back up.

Magnesium prices fell to a low range as smelters cut output and cost pressures rise. Inventory levels rise, but supply contraction signals may push prices back up.
Ingot prices dropped to a low before a modest rebound as procurement picks up. Supply remains tight, but demand recovery limits upward momentum.
| Product | Region | Incoterm Basis | Price | Last Updated Month |
|---|---|---|---|---|
| Magnesium | China | FOB | USD 2,356.80/MT | August 2026 |
| Magnesium | India | CIF | USD 2,447.59/MT | August 2026 |
| Magnesium | USA | CIF | USD 2,512.42/MT | August 2026 |
| Magnesium | Germany | CIF | USD 2,470.39/MT | August 2026 |
| Magnesium | Australia | CIF | USD 2,451.47/MT | August 2026 |
| Magnesium | China | FOB | USD 2,334.54/MT | July 2026 |
| Magnesium | India | CIF | USD 2,441.35/MT | July 2026 |
| Magnesium | USA | CIF | USD 2,522.03/MT | July 2026 |
| Magnesium | Germany | CIF | USD 2,468.17/MT | July 2026 |
| Magnesium | Australia | CIF | USD 2,433.00/MT | July 2026 |
Stay updated with the latest Magnesium prices, historical data, and tailored regional analysis
Asia
In China, the prices of Magnesium were ~USD 2,488.19/MT in April and ~USD 2,404.00/MT in June, showing a ~3.4% decrease. Chinese magnesium initially strengthened as buyers restocked and prompt cargo availability tightened, but the market reversed as high smelter operating rates and inventory accumulation increased supply pressure. April magnesium-product exports fell 21.9% month on month to 39,000 MT, indicating weaker fresh overseas demand. By May, primary production remained comparatively high while purchasing stayed cautious. Lower thermal-coal costs and record producer inventories intensified pressure in June. In India, the prices of Magnesium were ~USD 2,538.19/MT in April and ~USD 2,491.00/MT in June, showing a ~1.9% decrease. India followed the broader Asian downtrend as softer Chinese export values reduced regional replacement costs.
Europe
In Germany, the prices of Magnesium were ~USD 2,614.19/MT in April and ~USD 2,525.00/MT in June, showing a ~3.4% decrease. European buyers benefited from weakening Chinese export values because the region remains highly dependent on external magnesium supply. However, Tianjin-to-Rotterdam freight increased about ~18% during June, partly limiting the reduction in landed costs. Weak industrial purchasing and subdued alloy demand maintained downward pressure despite elevated logistics expenses.
North America
In the United States, the prices of Magnesium were ~USD 2,575.19/MT in April and ~USD 2,559.00/MT in June, showing a marginal decrease. U.S. magnesium remained comparatively resilient because net import reliance exceeds ~75%, keeping regional costs sensitive to freight, tariffs and overseas availability. In Canada, magnesium conditions also softened as Chinese material has a stronger influence on regional pure-metal and alloy supply channels. Improving North American automotive alloy demand provided some support, preventing a sharper decline.
Analyst Insight
According to Procurement Resource, magnesium conditions are expected to remain soft to stable as comfortable Asian supply and cautious demand offset support from freight costs and selective automotive consumption.
Related Report
Need Latest Magnesium Prices?
Get real-time price assessments, periodic trends, forecasts and price driver insights across key global markets.
Our Clients


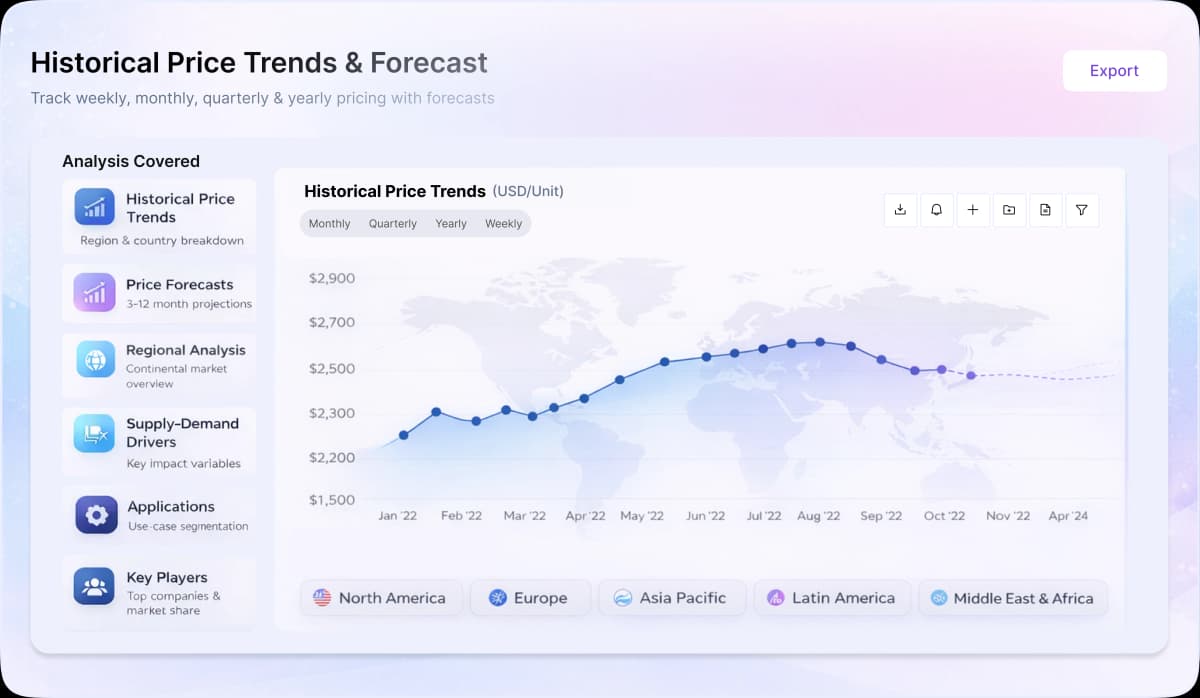
Turn price intelligence into action with the Procurement Resource Database. Log in or subscribe to unlock live price trends, historical charts, supplier databases, cost curves, and analyst-backed insights across chemicals, agriculture, energy, packaging, and more. Use these tools to benchmark your contracts, plan budgets with confidence, and stay ahead of market moves on every product you buy.
0
+Products
0
+Regions
0
+Subscriptions
Asia
During Q1’26, magnesium prices in Asia followed an upward trend, with China magnesium prices increasing by ~3.47% from January to March. Supply tightened as production declined in February and inventories remained controlled, while cost support from ferrosilicon and energy inputs strengthened producer sentiment. Global primary magnesium production was estimated at about 1.1 million metric tons, with China contributing about 950 thousand metric tons, maintaining its dominant position in global supply. Demand improved after the Lunar New Year from aluminium alloys, die-casting, and steel desulfurization sectors, supporting market activity. Export dynamics were influenced by higher freight and insurance costs following the Strait of Hormuz disruption, which raised landed costs and supported export offers.
Europe
During Q1’26, magnesium prices in Europe showed a firm trend, influenced by reliance on imports and exposure to global supply conditions. Higher logistics costs and shipping disruptions increased landed costs, while steady demand from automotive and industrial casting sectors supported consumption. However, cautious procurement and moderate industrial activity limited stronger upward movement.
North America
During Q1’26, magnesium prices in North America remained stable to firm, supported by steady downstream demand and supply dependence on imports. Demand from automotive lightweighting, aerospace components, and electronics applications sustained consumption levels. However, elevated freight costs and supply chain disruptions linked to the Iran war increased cost pressure, while cautious buying limited sharper price increases.
Formaldehyde (37%), or formalin, is a water-based saturated solution of 37% Magnesium is a silvery white solid that is not found in its free form in nature but rather found as carbonates, silicates, hydroxides, chlorides, or an amalgam. Pure metal burns with a white light in the air and is highly reactive. Magnesium is the lightest structural metal and is a good conductor of heat and electricity.
Mg
Medicines, cosmetics, explosives, pyrotechnic devices, aerospace, in alloys.
NIPPON KINZOKU CO., LTD., Latrobe Magnesium, Alliance Magnesium Inc., US Magnesium LLC, Regal Magnesium Co. Ltd., Dead Sea Magnesium Ltd., RIMA Group, Wenxi YinGuang Magnesium Industry (Group) Co., Ltd., Magontec Ltd, MagOne Products, WHY Resources.
CurrencyUS$ (Data can also be provided in local currency)
Supplier Database AvailabilityYes
Customization ScopeThe report can be customized as per the requirements of the customer
Post-Sale Analyst Support360-degree analyst support after report delivery
Note: Our supplier search experts can assist your procurement teams in compiling and validating a list of suppliers indicating they have products, services, and capabilities that meet your company's needs.
Magnesium is extracted from dolomite and magnesite ores. The ores are crushed, roasted followed by the addition of ground ores into the seawater in tanks leading to the settling of magnesium hydroxide, which is heated and mixed with coke and reacted with chlorine to form molten magnesium chloride, which is electrolyzed to obtain pure magnesium.
Our Price Analysis Methodology

Senior Business Insights Analyst
Delivering price trend analysis and procurement market insights at Procurement Resource, with expertise in identifying commodity patterns, supporting purchasing strategies, and improving cost efficiency through actionable market intelligence.

Experience how Procurement Resource transforms raw material price data into clear, decision ready intelligence. Optimise your performance with reliable, expert market data and analysis. Schedule your demo today to experience a live walk-through where our experts will showcase interactive price charts, forecasted prices, and insights driving the prices for your key commodities, tailored to your workflows. Contact us now!
Our Team will be happy to assist you
We are just a text away
Still Need Help?
Unlock full access to Procurement Resource's price databases, interactive charts, and short-term forecasts for thousands of commodities. Elevate your sourcing decisions by comparing prices across regions, downloading historical data, and layering in analyst-backed insights, all with our flexible plans that scale as your portfolio grows.
Still have any Questions
Contact Us



Price Trend Dashboard - What's Included
Price trends across a diverse portfolio of categories and products, spanning board to niche chemicals
Coverage extendable to grade-specific chemicals based on procurement requirements
Regular price tracking supported by robust historical datasets
News, policy updates, and key market drivers impacting price movements
Short-term and long-term price outlooks and forecasts
Supply–demand dynamics and capacity-driven market analysis

Track prices, market movements, supply-demand dynamics, and industry developments across hundreds of commodities through a centralized intelligence platform built for informed procurement decisions.

Understand market fluctuations using analyst-backed forecasts, historical pricing patterns, and evolving industry trends to strengthen sourcing strategies and budget planning.

Leverage cost models, pricing benchmarks, and procurement insights to evaluate purchasing opportunities, improve negotiations, and enhance operational efficiency.
Access region-specific price trends, trade activities, capacity changes, and supply chain developments influencing commodity markets worldwide.
