Silver prices corrected sharply from a January all-time high to current levels, driven by sentiment and macroeconomic factors. The market is in its sixth consecutive year of structural deficit, with industrial demand from solar, AI, and electrification remaining robust. Analysts maintain full-year average forecasts above the current price.
Silver Price Trend Analysis 2026: Price Drivers, Market Insights, Supply Demand Analysis, Latest News & Historical Prices
Written ByShriya Singh
Silver Price Trend Q2 2026
| Product | Region | Incoterm Basis | Price | Last Updated Month |
|---|---|---|---|---|
| Silver | China | FOB | USD 86.79/Ounce | May 2026 |
| Silver | India | CIF | USD 86.79/Ounce | May 2026 |
| Silver | USA | CIF | USD 86.79/Ounce | May 2026 |
| Silver | Germany | CIF | USD 86.79/Ounce | May 2026 |
| Silver | Australia | CIF | USD 86.79/Ounce | May 2026 |
| Silver | China | FOB | USD 84.56/KG | April 2026 |
| Silver | India | CIF | USD 134.56/KG | April 2026 |
| Silver | USA | CIF | USD 84.64/KG | April 2026 |
| Silver | Germany | CIF | USD 210.56/KG | April 2026 |
| Silver | Australia | CIF | USD 122.56/KG | April 2026 |
Stay updated with the latest Silver prices, historical data, and tailored regional analysis
Silver Price Trend Q1 2026
- Global silver prices showed a volatile to slightly downward trend in Q1 2026, with early gains reversing due to corrections and shifting monetary expectations, keeping overall sentiment unstable.
- Cost dynamics remained constrained as silver supply is largely dependent on byproduct mining, limiting quick output adjustments despite price movements and contributing to periodic tightness.
- Downstream demand stayed supportive, led by industrial use accounting for about 60% of total demand, especially from solar and electrification sectors, though high prices began to pressure consumption.
Silver prices moved unevenly across regions during Q1 2026, reflecting global volatility and demand shifts. In China, prices declined from RMB 22.93 RMB/g (Spot FD) in January to RMB 22.30/g in March, indicating mild weakness as market sentiment softened after earlier gains. In India, prices fell from INR 284.95/g in January to INR 277.76/g in March, marking a 4.75% decline, driven by cautious buying and pressure from global corrections.
In Europe, prices decreased from EUR 2.80/gram in January to EUR 2.26/gram (Spot) in March, despite a stronger performance compared to the previous quarter, where Q1 prices were significantly higher than Q4 levels. Globally, silver had surged in the past year, but volatility increased in early 2026 due to shifting dollar strength and changing expectations around monetary policy, triggering sharp corrections, including a steep single-session drop. Industrial demand from solar panels and electrification continued to support the market, though rising costs started to impact consumption patterns.
Analyst Insight
According to Procurement Resource, in the near term, silver prices are expected to remain volatile, with demand strength providing support while macroeconomic factors continue to drive global market fluctuations.
Related Report
Need latest Silver price?
Get real-time price assessments, periodic trends, forecasts and price driver insights across key global markets.
Unlock Price Insights NowLatest Developments
Our Clients


Procurement Resource Database

Turn price intelligence into action with the Procurement Resource Database. Log in or subscribe to unlock live price trends, historical charts, supplier databases, cost curves, and analyst-backed insights across chemicals, agriculture, energy, packaging, and more. Use these tools to benchmark your contracts, plan budgets with confidence, and stay ahead of market moves on every product you buy.
Silver Dashboard Inclusions

0
+Products
0
+Regions
0
+Subscriptions
| Product | Category | Region | Price | Last Updated Month |
| Silver | Energy, Metals and Minerals | China | 51252 USD/troy ounce | October 2025 |
| Silver | Energy, Metals and Minerals | China | 70267 USD/troy | December 2025 |
| Silver | Energy, Metals and Minerals | India | 54 USD/troy ounce | October 2025 |
| Silver | Energy, Metals and Minerals | India | 68 USD/troy ounce | December 2025 |
The global silver market experienced sustained appreciation during the fourth quarter, driven by persistent supply deficits and strong industrial demand across major consuming regions. Chinese markets displayed progressive strengthening as industrial consumption from electric vehicle manufacturing, solar panel production, and electronics sectors maintained elevated levels. The prices were about 51252 USD/troy ounce (Spot FD) in October and around 70267 USD/troy ounce in December. Safe-haven buying intensified amid geopolitical uncertainties and monetary policy easing expectations, while supply constraints from the fifth consecutive year of global market deficit provided fundamental support. China's announced plans to restrict physical silver exports added to market tightness concerns.
Indian markets witnessed consistent appreciation despite initial volatility, with exceptional festive demand during Dhanteras and Diwali generating substantial import volumes as consumers purchased silver for decorative and investment purposes. The prices were about 54 USD/troy ounce in October and around 68 USD/troy ounce in December. Supply remained constrained due to limited availability from traditional sources, while growing adoption in renewable energy and technology sectors supported investment demand. European markets mirrored Asian appreciation trends as industrial consumption from manufacturing sectors maintained steady requirements, with particular strength in technology and renewable energy applications. The prices were about 49 USD/troy ounce (Spot) in October and around 65 USD/troy ounce in December. Federal Reserve rate cut expectations supported the precious metals complex, while weakening dollar conditions enhanced silver's attractiveness as a safe-haven asset across all regions.
About Silver
Silver is a naturally occurring element. In appearance, Silver is a white and lustrous metal. It is used as jewellery, silverware, electronic equipment, and dental fillings. It is also utilised to make photographs, in brazing alloys and solders. Silver is known to have the highest electrical conductivity, thermal conductivity, and reflectivity than any metal.
Silver Product Detail
Chemical Formula
Ag
Molecular Weight
107.868 g/mol
Industrial Uses
Brazing alloys, Batteries, Dentistry, Glass Coatings, LED Chips, Medicine, Nuclear reactors, Photography, Photovoltaic (Or Solar) energy, RFID Chips (for tracking), Semiconductors, Ornaments, Touch screens, Water purification
Synonyms
7440-22-4, Argentum, Silver Metal, Silver Atom
Supplier Database
Umicore N.V, American Elements, MMC Norilsk Nickel PJSC, Hindustan Zinc Limited, Korea Zinc Co., Ltd., Yunnan Tin Group Company Limited (YTC), Polymetal International plc, Pan American Silver Corporation
Regional Coverage
Asia Pacific
China, India, Indonesia, Pakistan, Bangladesh, Japan, Philippines, Vietnam, Iran, Thailand, South Korea, Iraq, Saudi Arabia, Malaysia, Nepal, Taiwan, Sri Lanka, UAE, Israel, Hongkong, Singapore, Oman, Kuwait, Qatar, Australia, and New Zealand
Europe
Germany, France, United Kingdom, Italy,Spain, Russia, Turkey, Netherlands, Poland, Sweden, Belgium, Austria, Ireland Switzerland, Norway, Denmark, Romania, Finland, Czech Republic, Portugal and Greece
North America
United States and Canada
Latin America
Brazil, Mexico, Argentina, Columbia, Chile, Ecuador, and Peru
Africa
South Africa, Nigeria, Egypt, Algeria, Morocco
CurrencyUS$ (Data can also be provided in local currency)
Supplier Database AvailabilityYes
Customization ScopeThe report can be customized as per the requirements of the customer
Post-Sale Analyst Support360-degree analyst support after report delivery
Note: Our supplier search experts can assist your procurement teams in compiling and validating a list of suppliers indicating they have products, services, and capabilities that meet your company's needs.
Silver Production Process
- Production of Silver via Smelting.
Silver can be derived or extracted by using smelting or chemical leaching process, where heat and chemical reducing agents are utilised to get the base metal from the ore. Thus, smelting process leaves Silver behind from its ore. However, Silver can also be produced during the electrolytic refining of copper through Parkes process.
About the Author

Shriya Singh
Business Insights Analyst
Helping procurement and sourcing teams navigate complex markets through data-driven research, category intelligence, and actionable insights - with a focus on identifying market trends, analyzing supply-side developments, and delivering clear intelligence that supports informed business decisions.
Our Price Analysis Methodology


Schedule a demo
Experience how Procurement Resource transforms raw material price data into clear, decision ready intelligence. Optimise your performance with reliable, expert market data and analysis. Schedule your demo today to experience a live walk-through where our experts will showcase interactive price charts, forecasted prices, and insights driving the prices for your key commodities, tailored to your workflows. Contact us now!
Our Team will be happy to assist you
We are just a text away
Still Need Help?
Other Related Reports
Polyacetal Resin Production from Silver-Catalyzed Process
This report provides the cost structure of polyacetal resin production by the silver-catalysed process. In this process, methanol is oxidized to formaldehyde, using silver as a catalyst.
Unlock full access to Procurement Resource's price databases, interactive charts, and short-term forecasts for thousands of commodities. Elevate your sourcing decisions by comparing prices across regions, downloading historical data, and layering in analyst-backed insights, all with our flexible plans that scale as your portfolio grows.
Still have any Questions
Contact Us


Price Trend Dashboard - What's Included
Price trends across a diverse portfolio of categories and products, spanning board to niche chemicals
Coverage extendable to grade-specific chemicals based on procurement requirements
Regular price tracking supported by robust historical datasets
News, policy updates, and key market drivers impacting price movements
Short-term and long-term price outlooks and forecasts
Supply-demand dynamics and capacity-driven market analysis
Related News
View All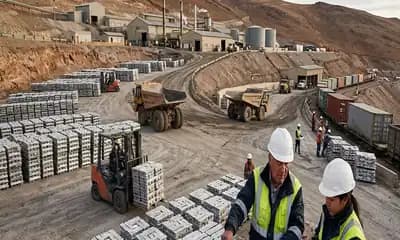

Why Procurement Database

Commodity Market Intelligence
Track prices, market movements, supply-demand dynamics, and industry developments across hundreds of commodities through a centralized intelligence platform built for informed procurement decisions.

Price Forecasts & Market Outlooks
Understand market fluctuations using analyst-backed forecasts, historical pricing patterns, and evolving industry trends to strengthen sourcing strategies and budget planning.

Cost & Procurement Optimization
Leverage cost models, pricing benchmarks, and procurement insights to evaluate purchasing opportunities, improve negotiations, and enhance operational efficiency.
Global & Regional Market Insights
Access region-specific price trends, trade activities, capacity changes, and supply chain developments influencing commodity markets worldwide.
1/4